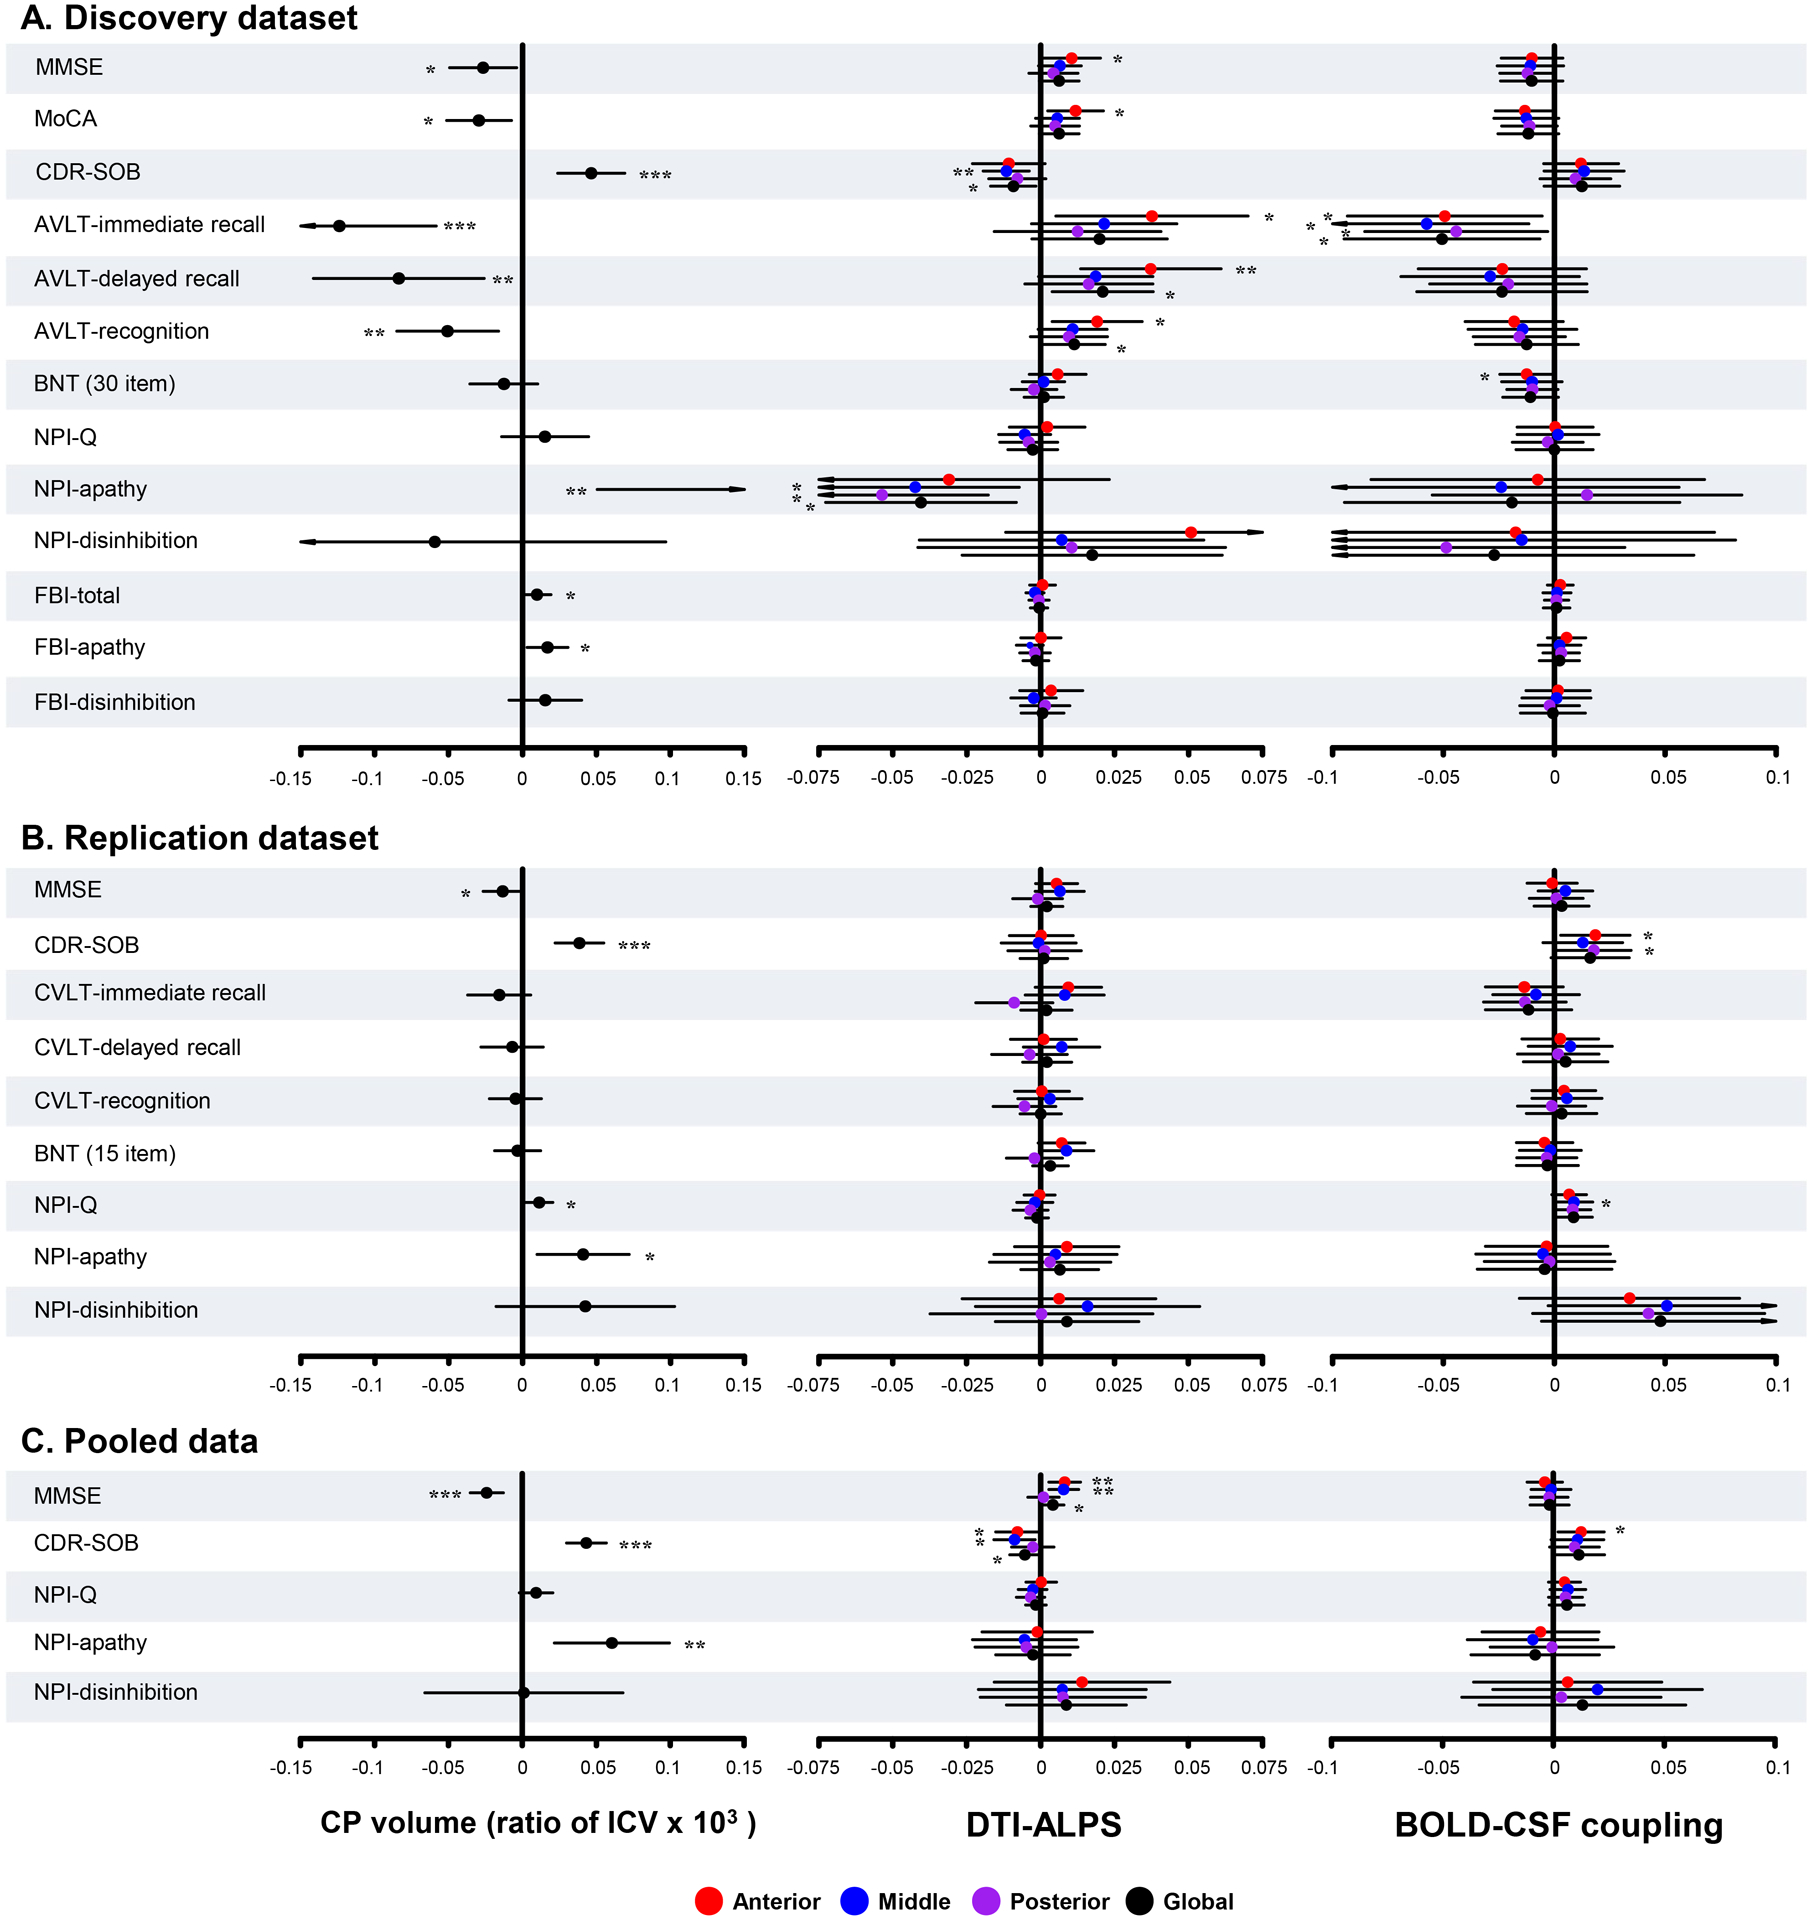
Figure 5: Regression analysis between glymphatic measures and neuropsychological test scores.

Forest plots show the results in the discovery dataset (A), the replication dataset (B), and the pooled data (C). The X axis shows the unstandardized β. P values were adjusted for age, sex, years of education, frontotemporal volume (discovery dataset), and scanning sites (replication dataset and pooled data). MMSE = Mini-Mental State Examination; MoCA = Montreal Cognitive Assessment; BNT = Boston Naming Test; AVLT = Auditory verbal learning test; CVLT = California Verbal Learning Test; CDR = Clinical Dementia Rating score; SOB = sum of boxes; NPI-Q = Neuropsychiatry Inventory Questionnaire; FBI = Frontal Behavioral Inventory; CP = choroid plexus; ICV = intracranial volume; g/a/m/pDTI-ALPS = global/anterior/middle/posterior diffusion along perivascular space index; g/a/m/pBOLD-CSF coupling = the coupling between blood-oxygen-level-dependent signals from global/anterior/middle/posterior cortical gray matter and cerebrospinal fluid signals. *P < 0.05, **P < 0.01, ***P < 0.001.
