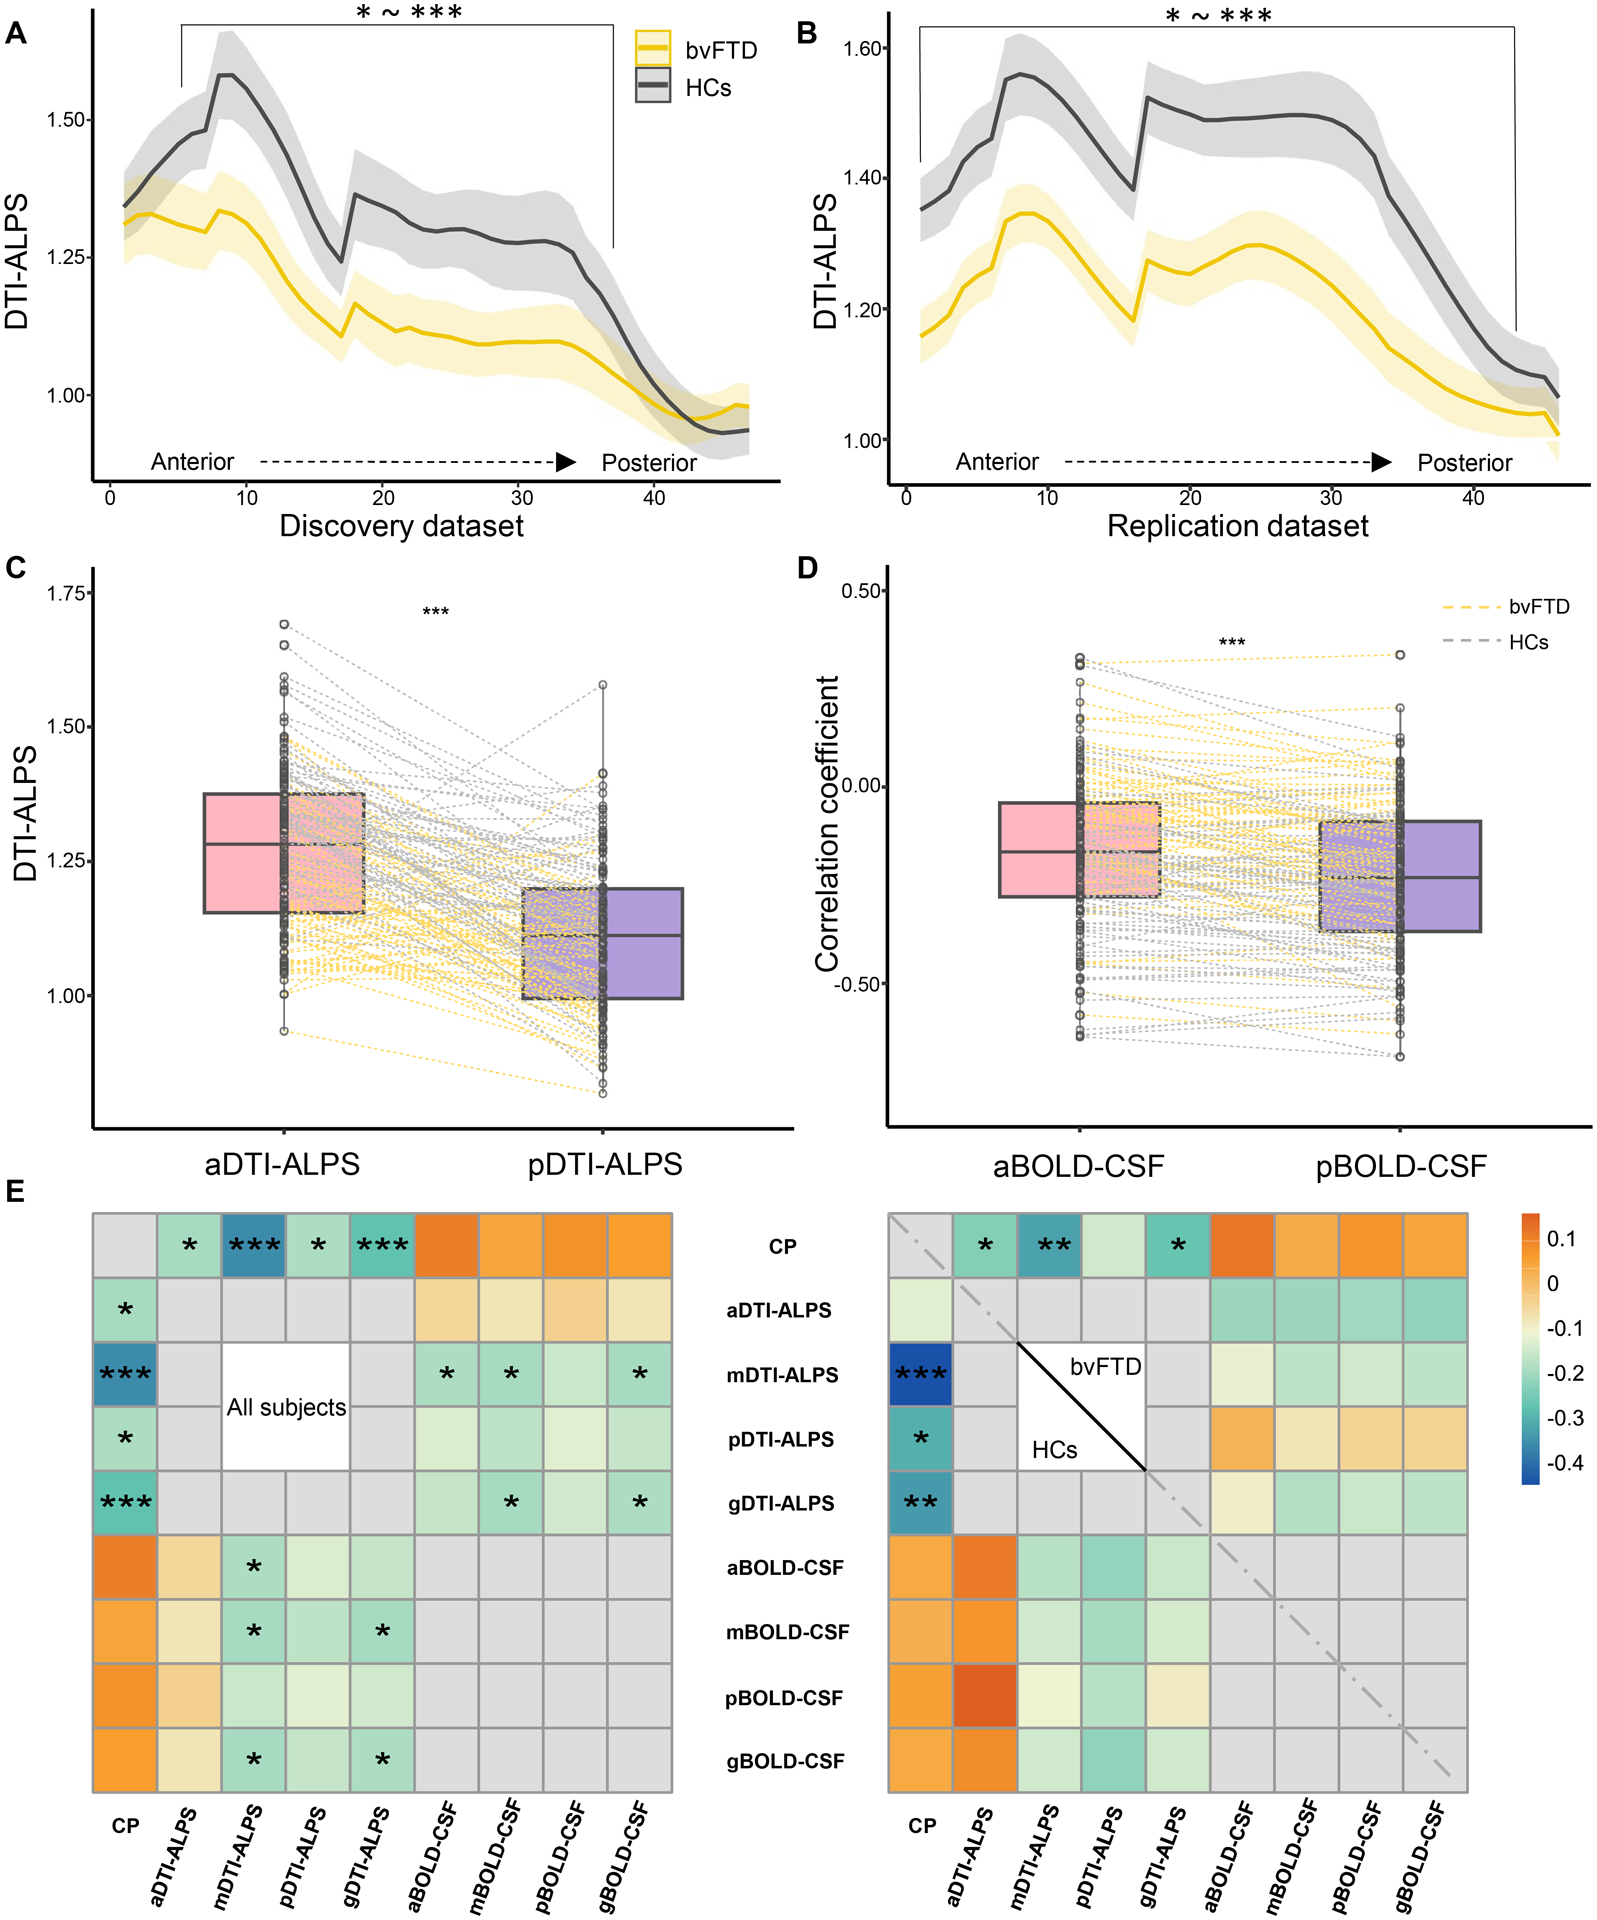
Figure 6: Glymphatic gradient and the relationship between different regional glymphatic functions.

(A-B) show the DTI-ALPS gradient and inter-group differences. (C-D) show the paired-sample t-test between aDTI-ALPS and pDTI-ALPS, and aBOLD-CSF coupling and pBOLD-CSF coupling, respectively. (E) Heatmaps show the relationship between glymphatic measures in the whole cohort and in the groups separately. P values in heatmaps were adjusted for age, sex, scanning sites (right), and groups (left). bvFTD = behavioral variant frontotemporal dementia; HCs = healthy controls. CP = choroid plexus; ICV = intracranial volume; g/a/m/pDTI-ALPS = global/anterior/middle/posterior diffusion along perivascular space index; g/a/m/pBOLD-CSF coupling = the coupling between blood-oxygen-level-dependent signals from global/anterior/middle/posterior cortical gray matter and cerebrospinal fluid signals. *P < 0.05, **P < 0.01, ***P < 0.001.
