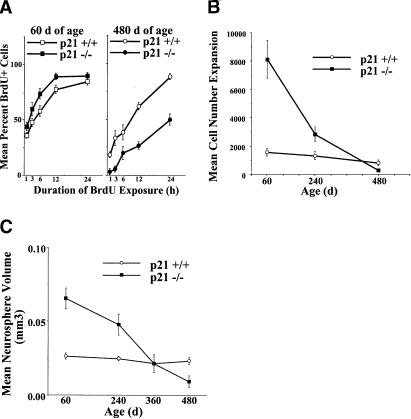
Figure 2.
p21 loss in vivo results in neural stem cell expansion and reduced longevity mediated by an initial decrease and subsequent increase in cell cycle time, respectively, as measured by BrdU labeling in vitro, cell expansion, and clonal neurosphere size. (A) Cumulative BrdU labeling of primary neurosphere cultures from p21+/+ and p21-/- mice at 60 d (left panel) and 480 d of age (right panel). Data are presented as mean ± SEM (n =3-4 per genotype per age per BrdU exposure time). There was a significant interaction between genotype and age [F (1, 81) = 57.74, p < 0.05] with BrdU labeling in a higher proportion of cells in primary neurospheres from 60-d p21-/- mice (p < 0.05), but in a lower proportion of cells in primary neurospheres from 480-d p21-/- mice (p < 0.05), relative to p21+/+ mice. Regression analyses of the BrdU incorporation data produced cell cycle estimates of 17.71 h for p21+/+ at 60 d, 14.27 h for p21-/- at 60 d, 20.21 h for p21+/+ at 480 d, and 43.80 h for p21-/- at 480 d. (B) Cell expansion (total number of cells at end of culture divided by initial number of cells; presented as mean ± SEM) in primary neurosphere cultures from p21+/+ and p21-/- mice at 60, 240, and 480 d of age (n =5-8 per group per age). There was a significant genotype by age interaction [F (2, 40) = 10.08, p < 0.05]. Cell number expansion is increased at 60 and 240 d of age (ps < 0.05), but decreased at 480 d of age (p < 0.05), in p21-/- neurosphere cultures relative to p21+/+. (C) Volumes (mean ± SEM) of primary neurospheres derived from adult p21-/- and p21+/+ mice at 60-480 d of age (n =5-8 per group per age). There was a significant genotype by age interaction [F (3, 42) = 4.84, p < 0.05]. Relative to p21+/+, primary p21-/- neurospheres were significantly larger than p21+/+ neurospheres derived from mice at 60 and 240 d (ps < 0.05), whereas primary p21-/- neurospheres were significantly smaller than p21+/+ from mice at 480 d (p < 0.05).

