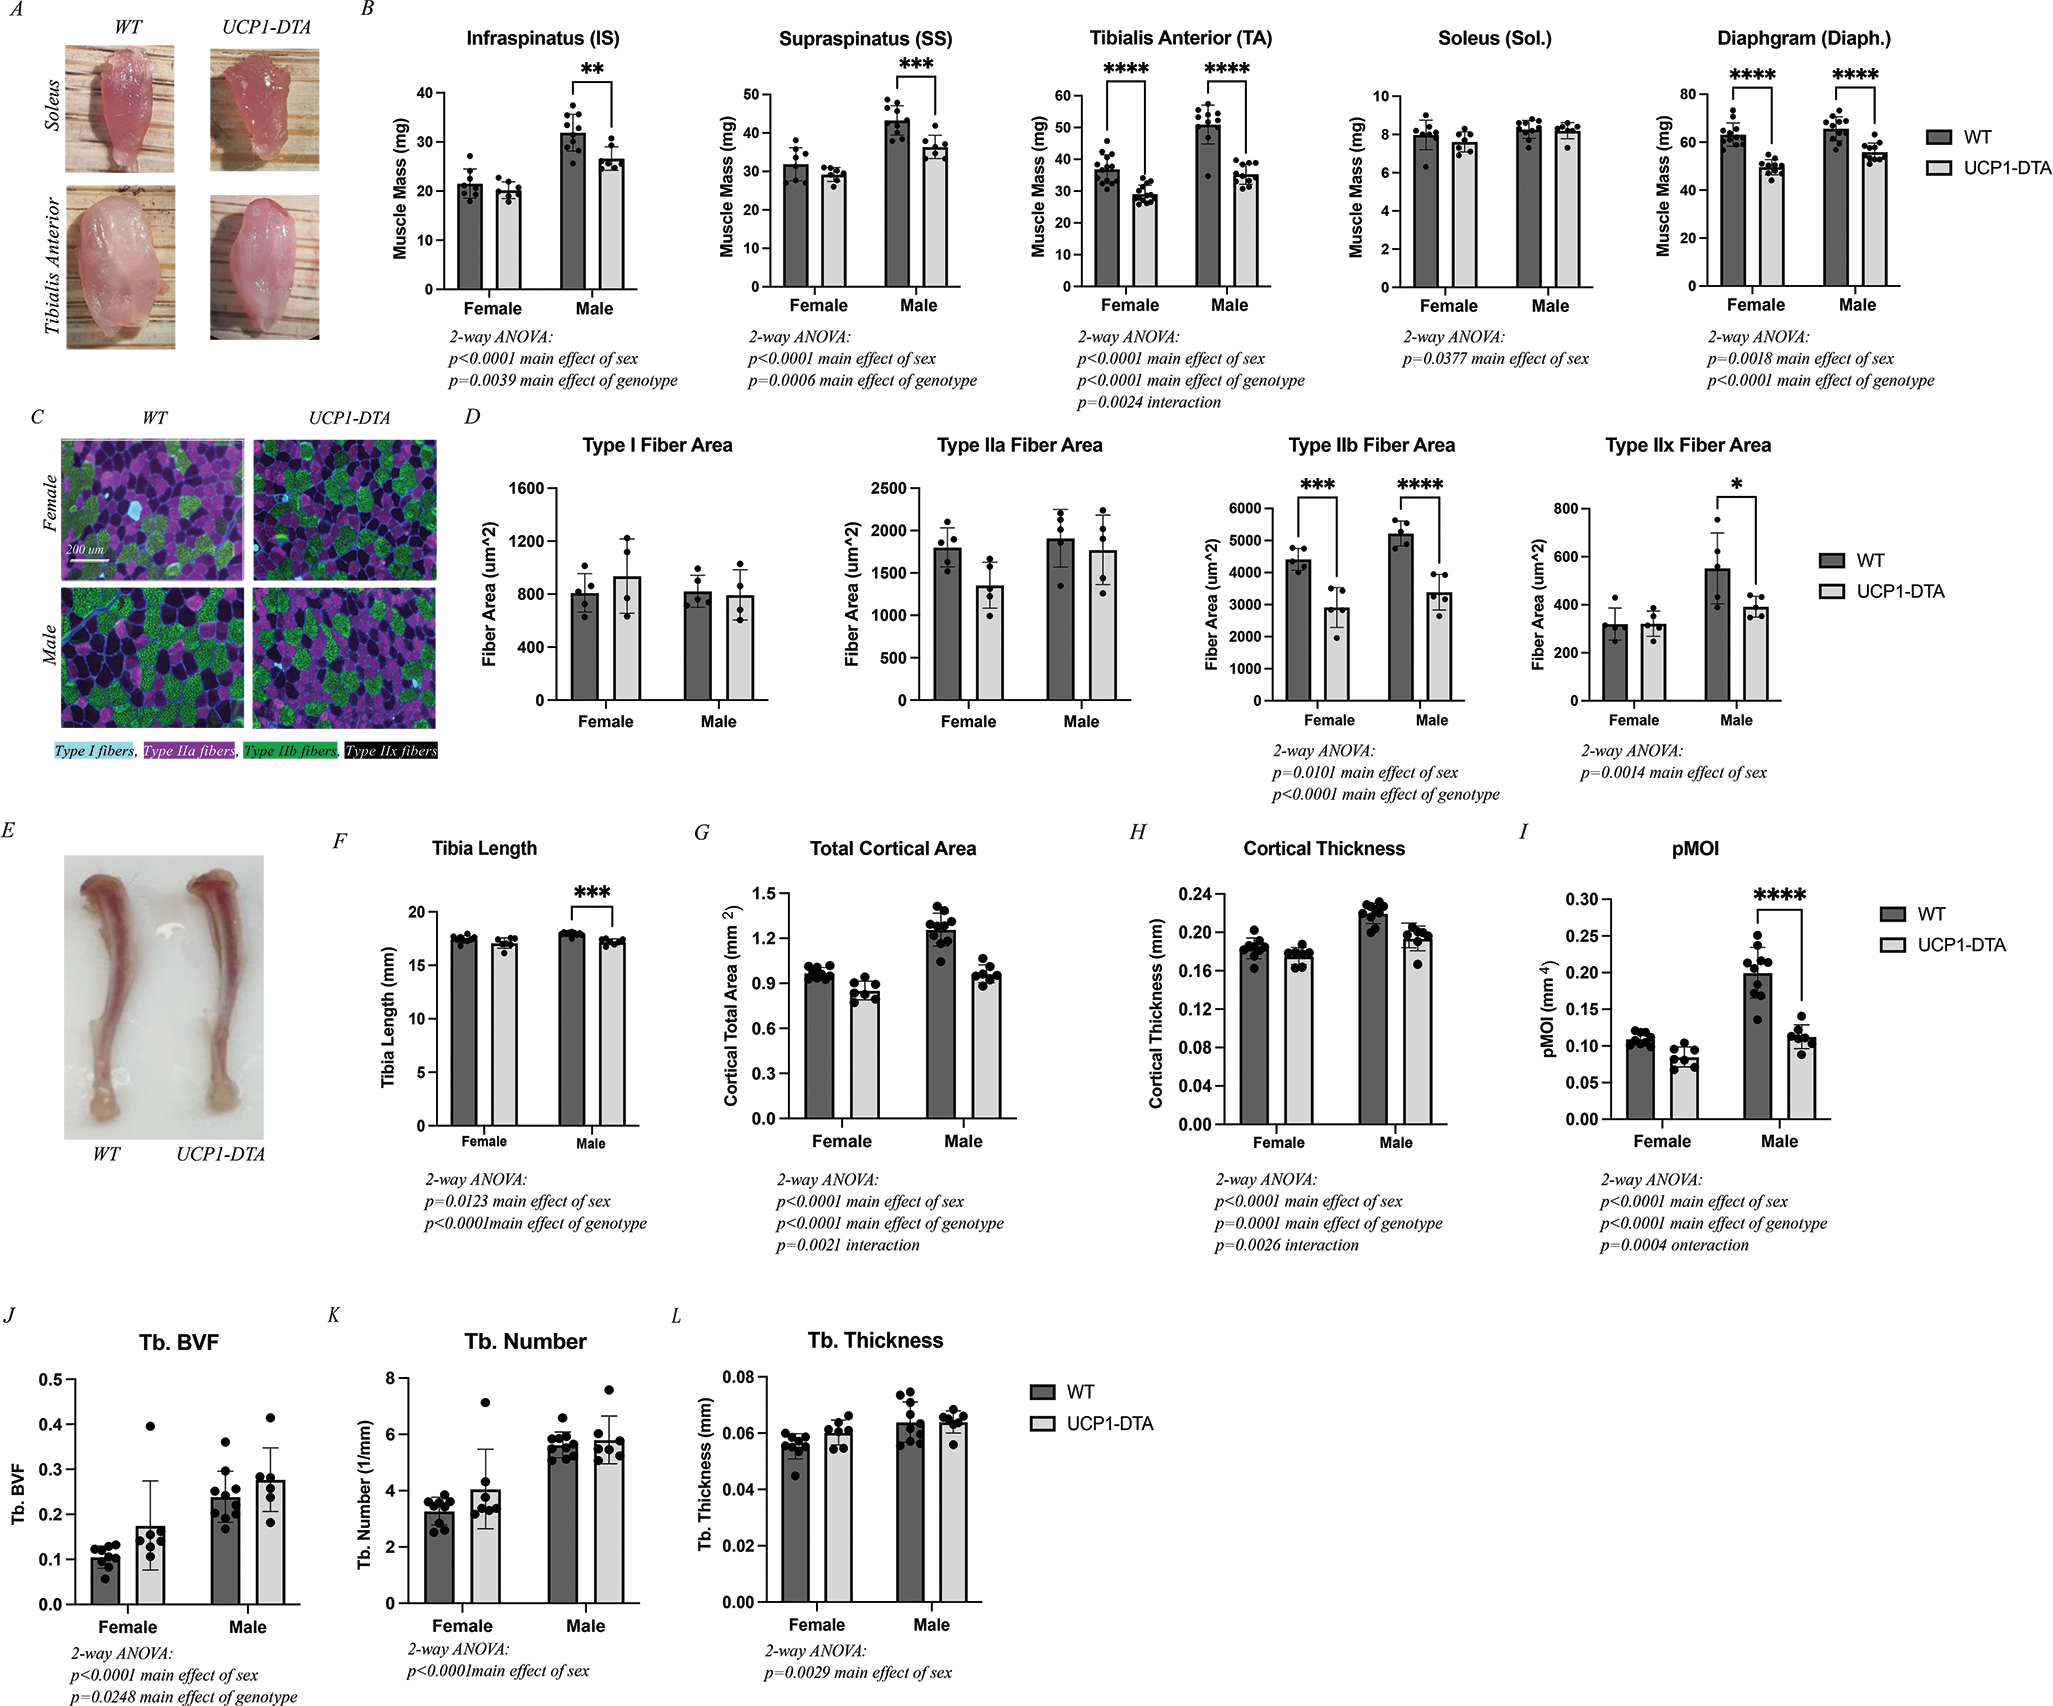
Figure 2. UCP1-DTA Mice Show Altered Skeletal Muscle and Bone Growth.

A Images of WT and UCP1-DTA soleus and tibialis anterior (TA) muscles illustrate gross size differences in the TA, but not the soleus. B Raw muscle masses harvested from female and male WT and UCP1-DTA mice including infraspinatus (IS), supraspinatus (SS), tibialis anterior (TA), soleus (Sol.), and diaphragm (Diaph.) demonstrating reduced mass in all but soleus muscles. C Representative 20x images of TA muscles from both female and male WT and UCP1-DTA immunostained against myosin heavy chain isoforms to detect specific fiber types. Type I fibers: Cyan, Type IIa: Magenta, Type IIb: Green, and Type IIx: Black/No channel. Scale bar represents 200 μm. D Analysis of fiber area by fiber type found a significant reduction in type IIb fiber area in UCP1-DTA males and females and type IIx fibers in males only. E Representative tibia bone images illustrate a small decrease in length in UCP1-DTA mice. F Analysis of tibia length with male WT mice have significantly longer tibias than UCP1-DTA males. G-I Total cortical area, cortical thickness and pMOI are modestly reduced in UCP1-DTA mice compared with WT. J-L Ttrabecular (Tb.) bone volume fraction (BVF), Tb. Number and Tb. Thickness are similar between UCP1-DTA and WT male and female mice. N=8–12. Data are presented as mean ± SD. *P<0.05, **P<0.01, ***P<0.001, ****P<0.0001. Statistical significance set at p<0.05. Analyses were in Prism using two-way ANOVA or multiple, independent t-tests.
