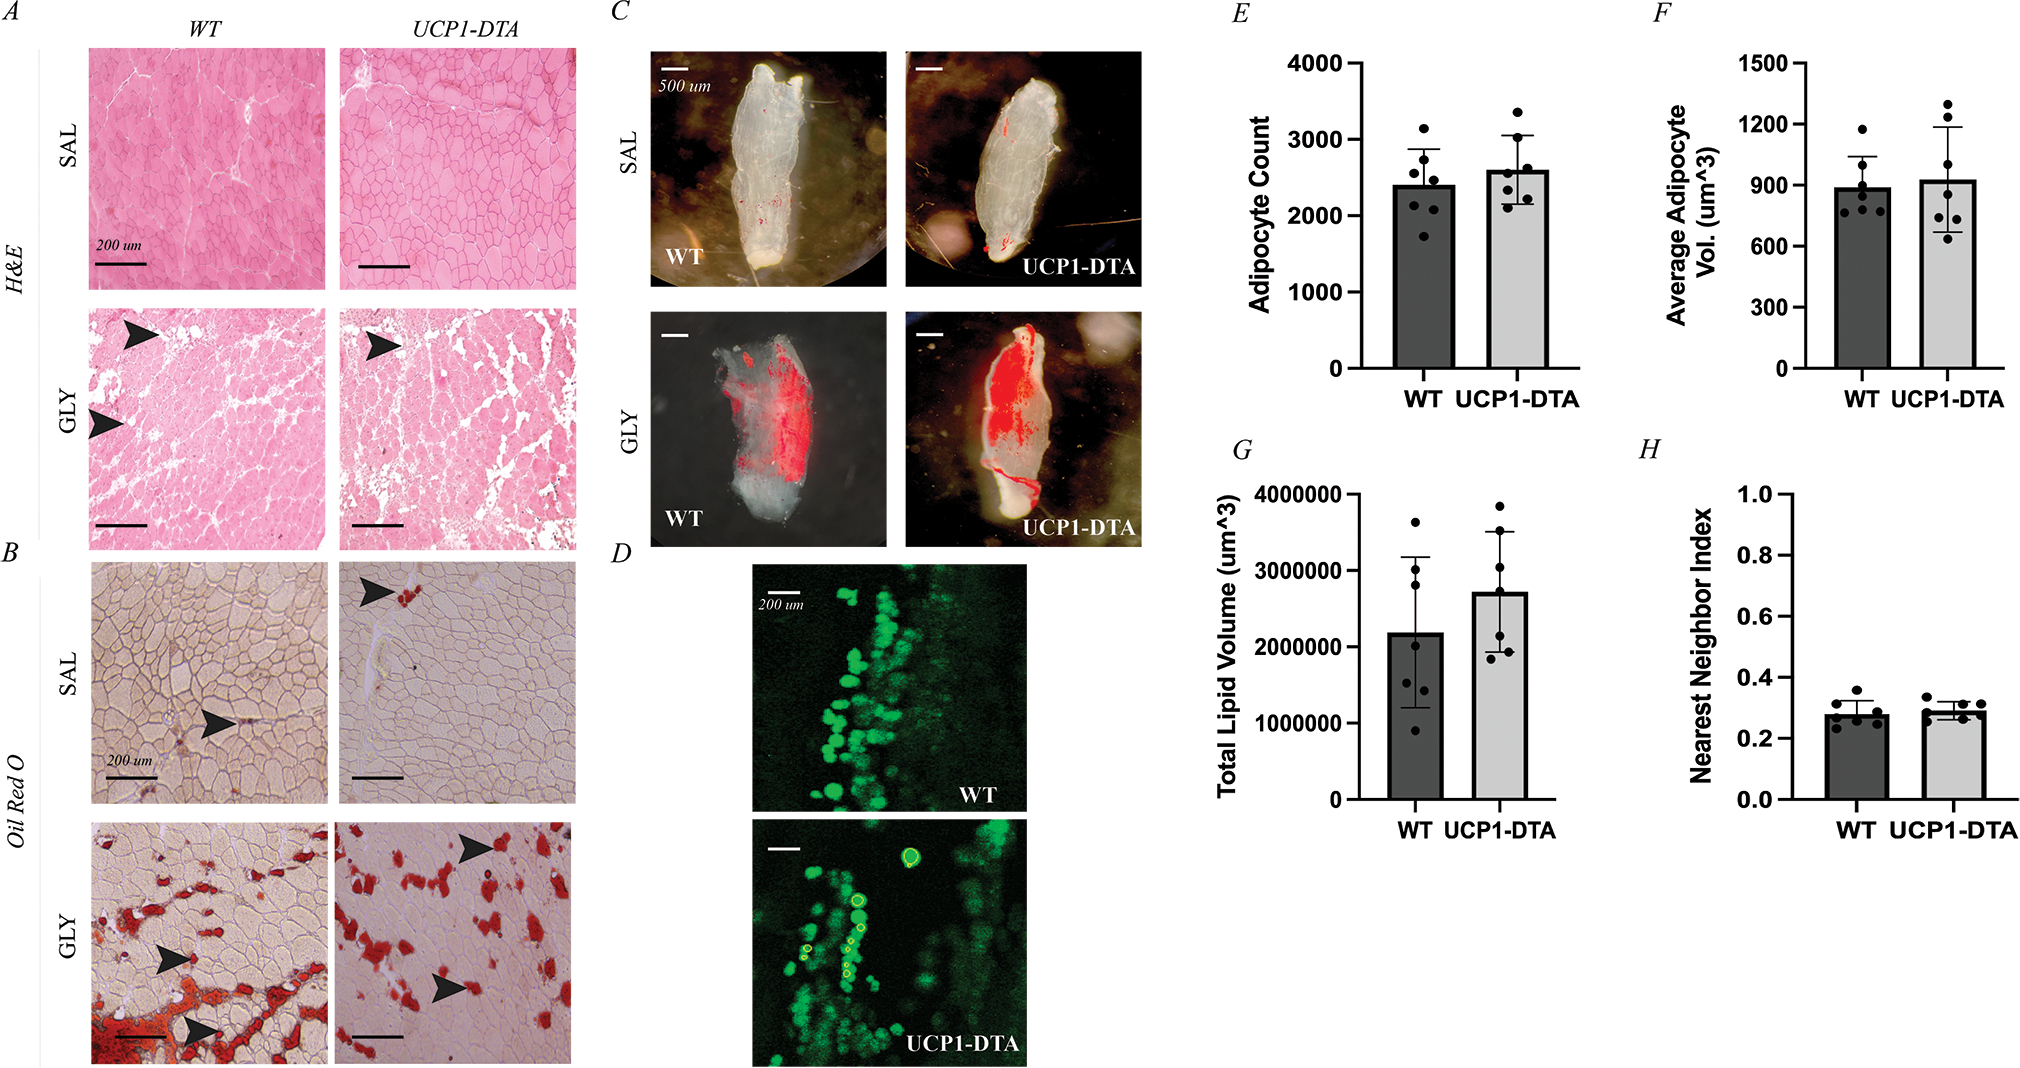
Figure 4. Glycerol-Induced IMAT Develops Without UCP-1-Expressing Cells.

A Hematoxylin and Eosin (H&E) staining of tibialis anterior (TA) muscle after 14 days of either saline (SAL) or glycerol (GLY) treatment shows extensive appearance of intramuscular adipocytes (IMAT) in GLY groups represented by white, globular structures (black arrows). B Oil Red O (ORO) staining of TA muscles identifies these intramuscular adipocytes as lipid filled (black arrows). C Oil Red O staining of decellularized EDL muscles of both wild type (WT) and UCP1-DTA genotypes injected with saline showing minimal IMAT (red) or injected with glycerol causing IMAT accumulation in similar amount between genotypes (red). Scale bars for A and B 1 mm. D Sample slices of EDLs treated with glycerol and stained with BODIPY and visualized using confocal microscopy in WT and UCP1-DTA mice. Individual adipocytes are identified as individual green circular regions of interest. E Quantification of adipocyte metrics via confocal microscopy in male WT and UCP1-DTA mice (n=21) showing similar average adipocyte count between genotypes in response to glycerol injection. F Average adipocyte volume similar in WT and UCP1-DTA mice. G Total lipid volume of WT and UCP1-DTA mice are similar with glycerol injection. H Nearest neighbor index as a measure of spatial clustering of intramuscular adipocytes show similar clustering between WT and UCP1-DTA mice. Data are presented as mean ± SD. Analysis performed in Prism using independent t-tests. Statistical significance set at p<0.05.
