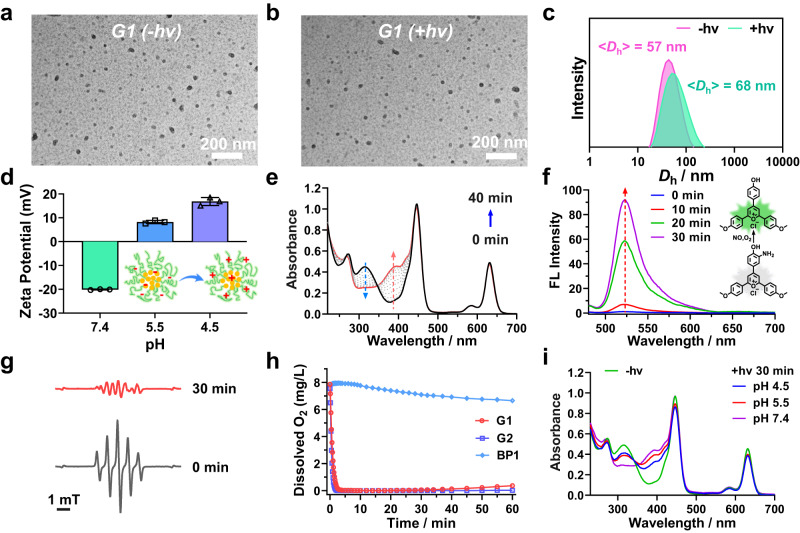
Fig. 3. Characterization of NO-releasing micellar nanoparticles.
a, b TEM images and (c) intensity-average hydrodynamic diameter distributions of G1 micelles (0.2 g/L) with or without 630 nm irradiation for 30 min. d ζ potentials of G1 micelles at different pH. Data are presented as mean values ± SD (n = 3 independent samples). e UV-vis spectra of G1 micelles in PBS buffer (pH 7.4) without deoxygenation under 630 nm light irradiation. f Evolution of fluorescence emission spectra (λex = 470 nm) of G1 micelles with pyrylium cation-based NO probe (NOFP) (50 μM) under 630 nm irradiation. g EPR spectra of G1 micelles with or without 630 nm irradiation for 30 min. h Changes in oxygen concentrations of aqueous dispersions of G1, G2, and BP1 micelles under 630 nm light irradiation. i UV-vis absorbance spectra of deoxygenated G1 micelle at varying pH values (7.4, 5.5, and 4.5) without or with 630 nm irradiation for 30 min. In all cases, the irradiation intensity was 39 mW/cm2. Source data are provided as a Source Data file.

