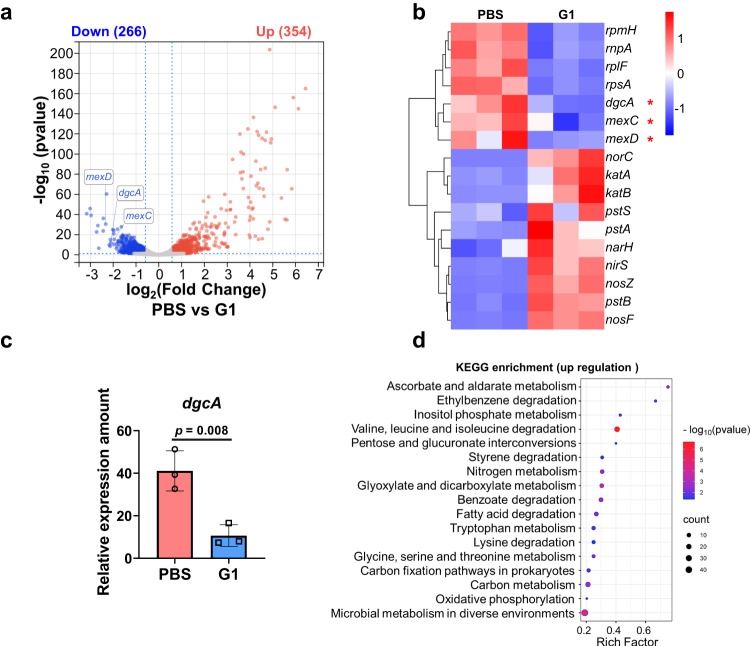
Fig. 5. Gene expression in CRPA bacteria.
a Volcano plots of differentially expressed genes (gray: not significantly different genes; red: upregulated genes; blue: downregulated genes), (b) heatmap of differentially expressed genes, (c) relative gene expression of dgcA and (d) KEGG enrichment of upregulated genes of CRPA treated with PBS or G1 micelles with 630 nm light irradiation for 30 min (39 mW/cm2). Data are presented as the mean values ± SD (n = 3 independent samples). Statistical analysis was calculated by two-tailed Student’s t-test. Source data are provided as a Source Data file.

