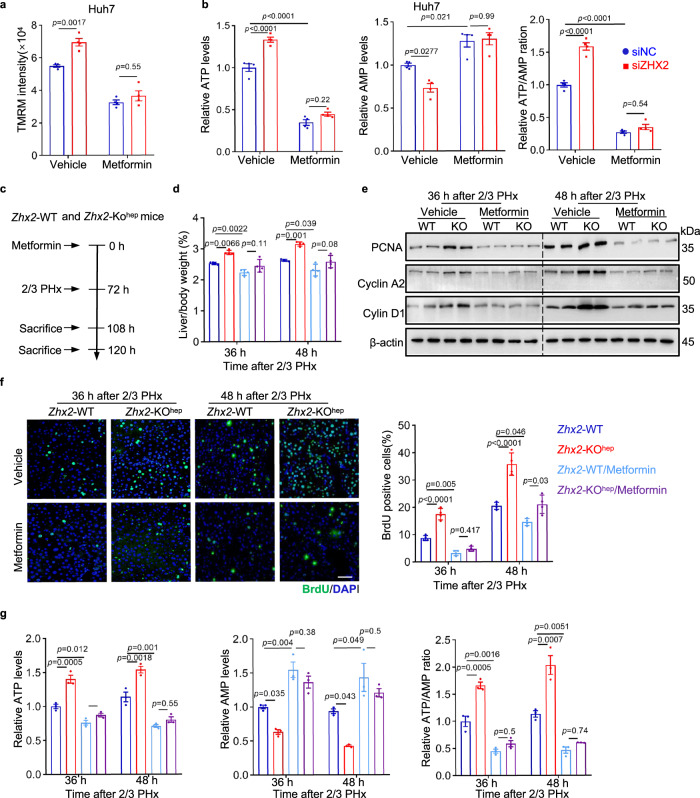
Fig. 4. Metformin treatment inhibits OXPHOS activity and dampens augmented liver regeneration in Zhx2-KOhep mice.
a, b Huh7 cells were transfected with siNC and siZHX2, following with metformin or vehicle treatment. TMRM intensity (a), ATP and AMP levels, and ATP/AMP ratio (b) are shown. Representative data are presented as mean ± sd (two-way ANOVA with Tukey’s test. n = 4; n biologically independent samples). c Diagram for metformin administration in Zhx2-KOhep and Zhx2-WT mice with 2/3 PHx. d Liver/body weight ratios of Zhx2-WT and Zhx2-KOhep mice with or without metformin administration were measured at 36 and 48 h after 2/3 PHx. Data are presented as mean ± s.e.m. (one-way ANOVA with Tukey’s test. n = 4 mice per group). e Expression of PCNA, Cyclin A2 and Cyclin D1 in Zhx2-WT and Zhx2-KOhep livers with or without metformin treatment were obtained at 36 and 48 h after 2/3 PHx by western blot. f BrdU-positive cells in livers from metformin and vehicle-administrated Zhx2-KOhep and Zhx2-WT mice were determined by immunofluorescence staining. Reprehensive images are shown on the left panels and the quantitative data are shown on the right panels. Scale bar: 50 μm. Data are presented as mean ± s.e.m. (one-way ANOVA with Tukey’s test. n = 4 mice per group). g Levels of ATP and AMP, and ratio of ATP/AMP were determined in livers from Zhx2-KOhep and Zhx2-WT at 36 h and 48 h after 2/3 PHx with/without metformin administration. Data are presented as mean ± s.e.m. (one-way ANOVA with Tukey’s test. n = 3 mice per group).

