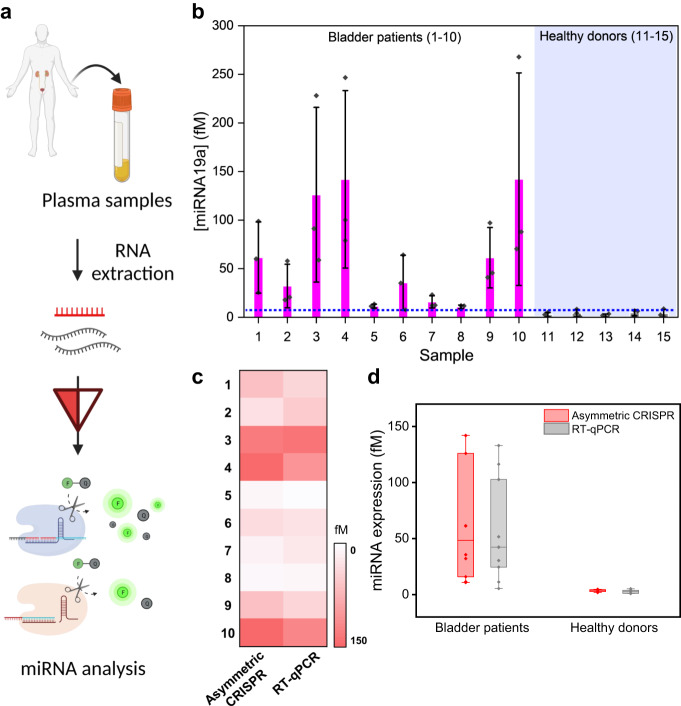
Fig. 6. Clinical application of the asymmetric CRISPR assay for amplification-free miRNA detection in clinical samples.
a Schematic illustration of miRNA detection in human plasma samples using the asymmetric CRISPR assay. Illustration was created with BioRender.com. b Estimated target miR-19a concentrations in the bladder patient plasma samples (samples 1–10) and the healthy donor plasma samples (samples 11–15). The Blue dashed line represents the highest target miRNA concentration of healthy donors plus standard deviation. (n = 3, Data are represented as mean ± S.D of three technical replicates.) c Heatmap of the estimated target miR-19a concentrations of the asymmetric CRISPR assay and conventional RT-qPCR assay. d miR-19a expression level analyzed by asymmetric CRISPR (red) and RT-qPCR (black) in bladder patients and healthy donors. The center line represents the median expression level, the bounds of the box indicate the interquartile range, and the whiskers indicate the maximum and minimum values. Source data are provided as a Source Data file.

