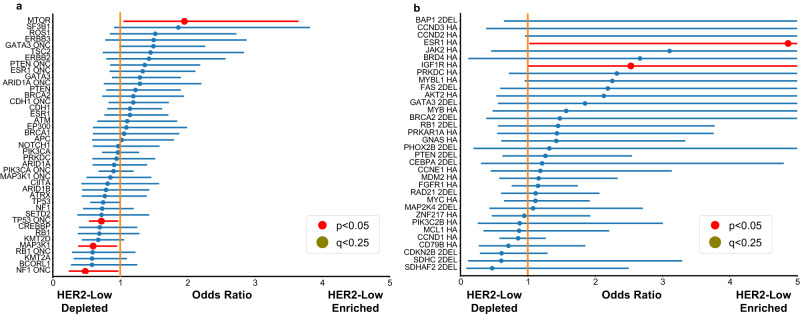
Fig. 3. Enrichment analysis of genomic alterations between HER2-low (n = 482) and HER2-0 (n = 551).
a The enrichment analysis for mutations; b the enrichment analysis for copy number variations (CNV). Modeling was done using multivariate logistic regression accounting for ER status and background rate of either mutation or copy number events, using the statsmodel package in Python. ER-low cases were included in the ER-positive group. Only models that reached a significant value for rejecting the log-likelihood null were included after multiple hypothesis correction using BH-FDR, as well as those that converged after 500 iterations. Only mutations that appeared in over 4% of either all HER2-0 or HER2-low samples were included. On the left, lines labeled “_ONC” represent only oncogenic mutations, while the CNVs were done on 2DELs or high amplifications for tumor suppressor genes and oncogenes, respectively (labeled in the figure). Error bars are reported as the 95% confidence interval. P-values are determined as the likelihood of the model’s calculated coefficients under the assumption that the true coefficients are 0 and are reported as two-tailed. Multiple hypothesis correction was done using BH-FDR. Exact p-values are reported in the source data of this figure. These are the same statistical tests used in the Supplementary Data File, Supplementary Figs. 3 and 6. CNV copy number variations, ER estrogen receptor, HER2 human epidermal growth receptor factor.

