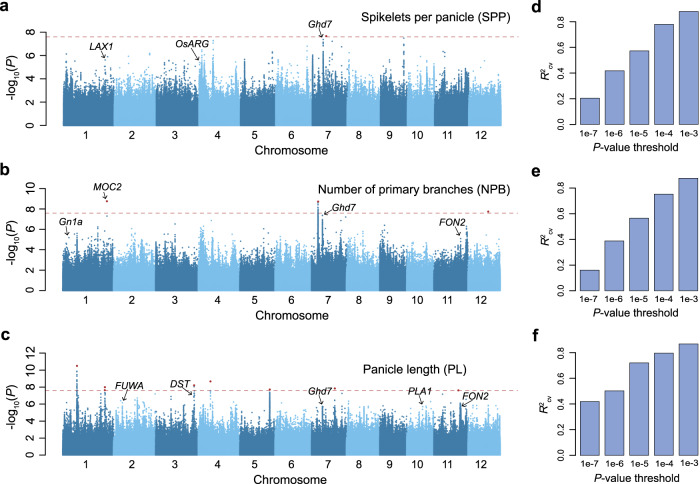
Fig. 2. GWAS and genetic variance composition of panicle traits.
a–c Manhattan plots of GWAS using linear mixed model for the number of spikelets per panicle (SPP), the number of primary branches (NPB), and panicle length (PL). The red dashed lines indicate the genome-wide significance threshold (2.54 × 10⁻⁸, multiple comparisons corrected by 0.05/No. independent variants), and the red points indicate lead variants of genome-wide significant QTLs. Genes that have been reported to be related to panicle architecture within 100 kb of significant loci at the 1 × 10⁻⁵ threshold are marked out. d–f The phenotypic variance explained by GWAS lead variants identified at different p value thresholds for SPP, NPB, and PL. The explained phenotypic variances are assessed by tenfold cross-validation using LASSO. R2: predicted values versus observed phenotypes.

