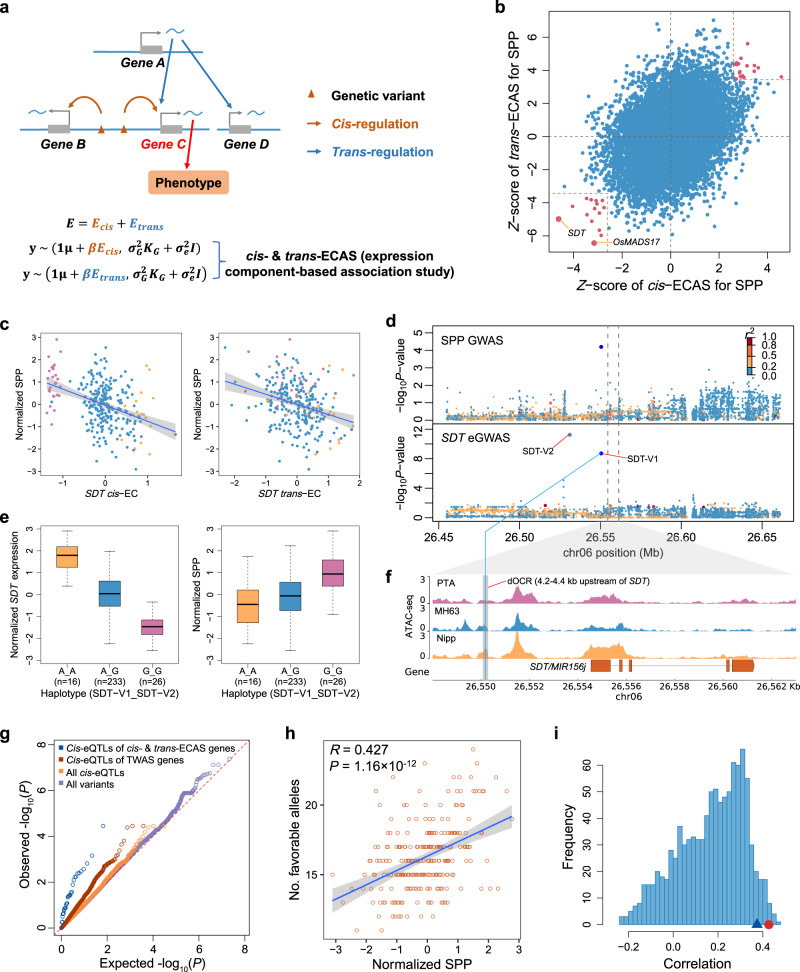
Fig. 6. Identification of putative causal genes by cis- and trans-expression component-based association study (cis- and trans-ECAS).
a A schematic diagram of identifying putative causal genes by cis- and trans-ECAS. See main text for details. b Scatter plot of the association of SPP with cis-EC (x-axis) and trans-EC (y-axis) of genes. Red dots indicate genes whose both cis- and trans-EC are significantly associated with SPP. c Correlations of SPP with cis-EC (left) and trans-EC (right) of SDT. The colors of the dots represent different haplotypes which are the same as in (e). The error bands indicate 95% confidence intervals. d Regional association plots of GWAS for SPP (top) and SDT expression (eGWAS, bottom) in a 200-kb region centered on SDT. The colors of the dots represent the linkage disequilibrium (measured by r2) of each variant with the lead variant of GWAS for SPP (dark blue). p values of SDT-V1 and SDT-V2 were calculated using a multivariate linear mixed model with SDT-V1 and SDT-V2 as independent variables, while p values for the other variants were calculated using a linear mixed model with SDT-V1 and SDT-V2 as covariates71. e Box plots of SDT expression and SPP of different haplotypes. The x-axis indicates the haplotypes formed by combining genotypes of SDT-V1 (A/G) and SDT-V2 (A/G). The definitions of the box plots are the same as Fig. 4b. f Chromatin accessibility profiles of three varieties with different haplotypes around the SDT. PTA, MH63, and Nipp indicate the varieties of Padi Tarab Arab, Minghui63, and Nipponbare, respectively, which belong to the three haplotypes in (e) (G_G, A_G, and A_A, respectively). The y-axis values are Counts Per Million mapped reads (CPM) of ATAC-seq. The gray rectangular area indicates the distal open chromatin region (dOCR) surrounding SDT-V1 (blue line), where changes in chromatin accessibility are consistent with variations in SDT expression. g Q-Q plot of GWAS signals for SPP for different groups of variants. h The correlation between SPP and the number of favorable alleles at cis-eQTLs for the cis- and trans-ECAS significant genes of SPP in each variety. The analysis included 254 varieties, for which transcriptome data were not acquired. Alleles that up-regulate PAGs or down-regulate NAGs are defined as favorable alleles. Pearson’s correlation coefficient is used for the test. i Histogram of the correlations between SPP and the number of favorable alleles at cis-eQTLs for randomly selected TWAS significant genes. The same number of genes as the cis- and trans-ECAS genes were selected each time from TWAS significant genes with significant cis-genetic variance and repeated 1000 times. The blue triangle indicates the 0.95 quantiles of the correlations, and the red dots indicate the correlation between phenotypes and the numbers of favorable alleles at cis-eQTLs for the cis- and trans-ECAS genes. Source data underlying (b, c, e, h) are provided as a Source Data file.

