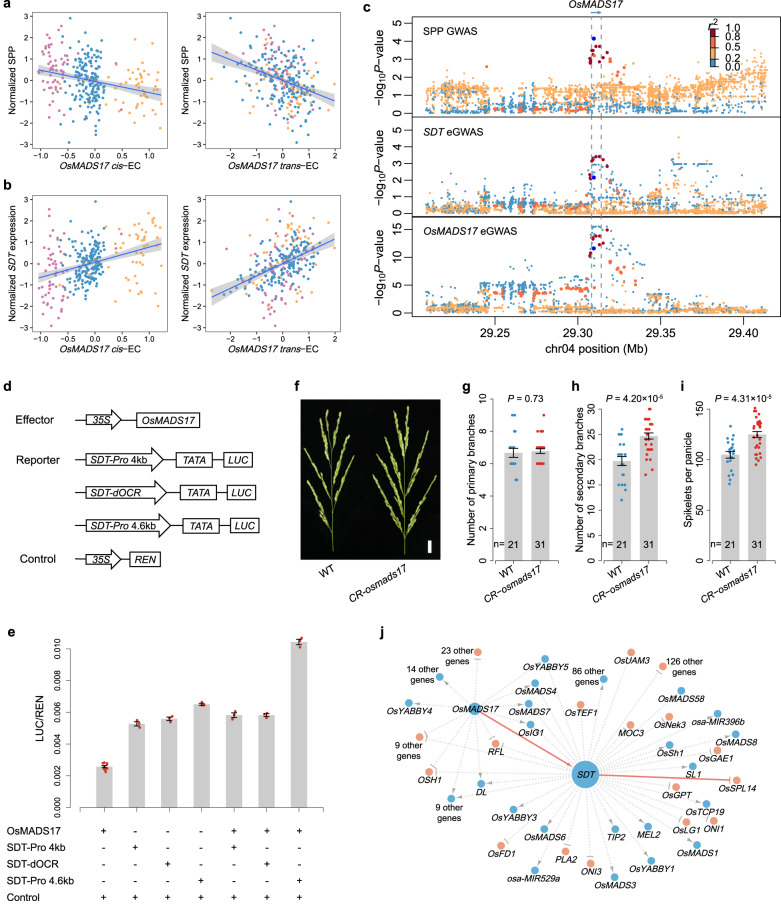
Fig. 7. OsMADS17 regulates SDT transcription and affects SPP.
a Correlations of SPP with cis-EC (left) and trans-EC (right) of OsMADS17. The colors of the dots represent different genotypes of the OsMADS17-V1 variant: reference type (orange), 11-bp deletion type (blue), and 39-bp deletion type (purple). The error bands indicate 95% confidence intervals. b Correlations of SDT expression with cis-EC (left) and trans-EC (right) of OsMADS17. The colors of the dots represent different genotypes of OsMADS17-V1, as in (a). c Regional association plots of GWAS using linear mixed model for SPP (top), SDT expression (middle) and OsMADS17 expression (bottom) in a 200-kb region centered on OsMADS17. d Schematic diagram of the effector and reporter constructs used for transient transcriptional activity assay in (e). Firefly luciferase gene LUC, driven by the 4-kb and 4.6-kb promoters of SDT as well as dOCR (4.2–4.4 kb upstream of SDT, as shown in Fig. 6f), was used as the reporter. e Transient transcriptional activity assay showing that OsMADS17 transactivates SDT transcription and this transactivation requires the dOCR upstream of SDT. All data are means ± SEM (9 biologically independent samples for OsMADS17 + control and 3 for the others). f Panicle morphologies of CR-osmads17 mutant and WT. WT wild-type. Scale bar, 2 cm. g–i Quantification of the number of primary branches (g), number of secondary branches (h), and spikelets per panicle (i) in the main panicle of CR-osmads17 mutant and WT. Data are means ± SEM. Comparisons are made by two-tailed Student’s t test. j Gene regulatory networks constructed using cis- and trans-ECAS. The SPP TWAS-significant genes (FDR <0.01) were used as e-traits, and the network centered on SDT and OsMADS17 (SDT and OsMADS17 as regulatory genes) is shown. The color of the nodes indicates the regulatory direction of genes for SPP: light salmon for positive correlation and blue for negative correlation. The size of each node circle indicates the number of nodes it connects to. Solid lines represent the regulatory relationships validated in this study and those previously reported. Source data underlying (a, b, e, g–i) are provided as a Source Data file.

