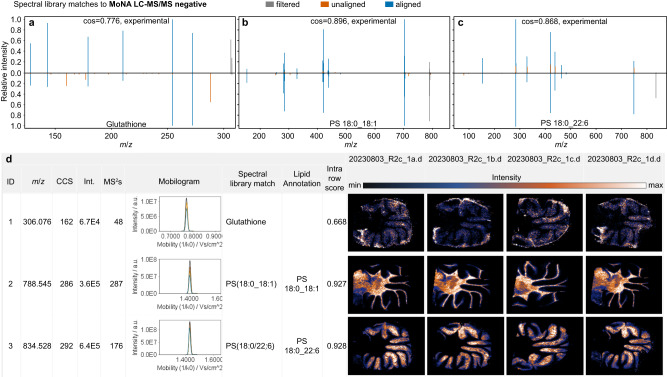
Fig. 3. Composition of data and result views in the MZmine GUI.
a–c show spectral library matches to the public MoNA LC-MS/MS negative mode library. Spectral match to a reference spectrum of the metabolite glutathione (a), and the phosphatidyl serines PS 18:0_18:1 (b) and PS 18:0_22:6 (c). Multiple MS2 spectra were acquired across the tissue by MALDI-TIMS-SIMSEF. d The feature table summarises all features by their properties (e.g., m/z and CCS) and adds interactive charts linked to the underlying data structures. SMART notation for images48: Step size: 50 µm, spot size: 30 µm, identification confidence: MSI level 2, resolution: 40,000 FWHM @m/z 1,221, Time 48 min (R2c_1a), 50 min (R2c_1b), 40 min (R2c_1c), 54 min (R2c_1d).

