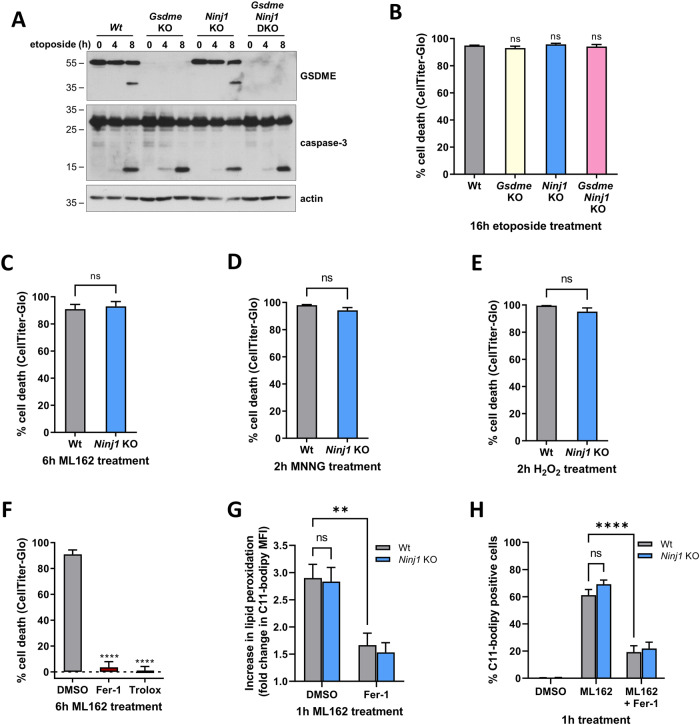
Fig. 4. NINJ1 regulates plasma membrane permeabilization downstream of metabolic cell death.
A, B Wild-type, Gsdme KO, Ninj1 KO and Gsdme Ninj1 DKO MEFs were stimulated with etoposide. Next, the amount of GSDME and caspase-3 processing after the indicated duration was analyzed by immunoblotting (representative of at least two independent experiments) (A) or the intracellular ATP levels were measured after 16 h by CellTiter-Glo (B). C–E Wild-type and Ninj1 KO MEFs were stimulated for 6 h with ML162 (C), for 2 h with MNNG (D) or for 2 h with H2O2 before measurement of the intracellular ATP levels by CellTiter-Glo. F Wild-type MEFs were pretreated for 30 min with DMSO, Fer-1 or Trolox before stimulation of 6 h with ML162. The intracellular ATP levels were afterwards measured by CellTiter-Glo. G, H Wild-type and Ninj1 KO MEFs were pretreated or not for 30 min with Fer-1 before stimulation with ML162 for 1 h. The extent of lipid peroxidation was determined by the fluorescence of oxidized C11-bodipy measured via flow cytometry. Data are presented as the fold change of the MFI over DMSO-stimulated cells (G) or as the percentage of C11-bodipy positive cells (H). Data in the graphs are presented as mean ± SEM of independent experiments (n = 3). Statistical significance was determined by an unpaired two-tailed T test (C–E), by one-way ANOVA with Dunnett post hoc testing (B, F) or by two-way ANOVA with Sidak post hoc testing. **P ≤ 0.01, ****P ≤ 0.0001.

