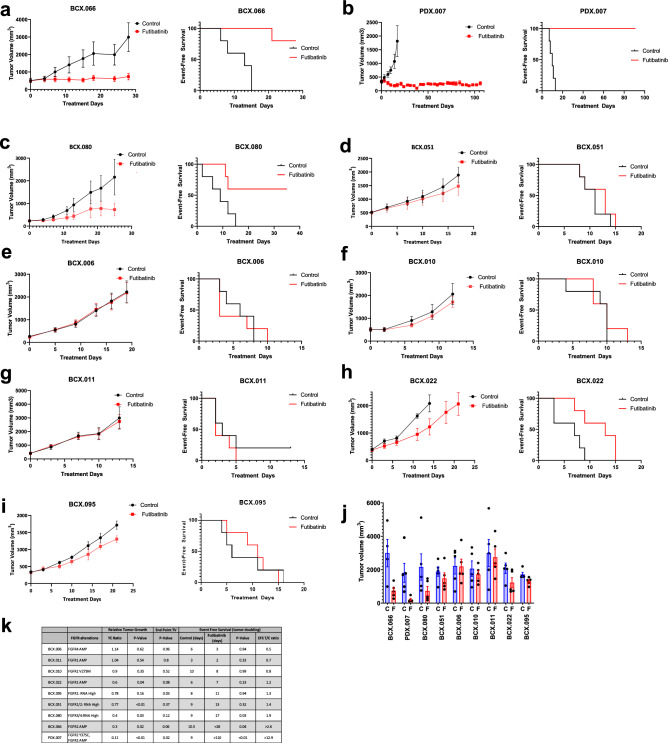
Figure 2.
Response of patient-derived xenografts (PDXs) to the fibroblast growth factor receptor (FGFR) inhibitor futibatinib. (a–i) Female mice bearing breast cancer PDXs (n = 5 per group) were treated orally with the vehicle control or futibatinib (15 mg/kg/day). The treatment was stopped at 28 days or when the tumor diameter reached 1.5 cm3, except for mice bearing the PDX.007 model, in which the treatment was stopped on day 110. Growth (left) and event-free survival duration (right, defined as days until tumor doubling) curves are shown for each model. Growth curve graphs show the mean change in TV (mm3) ± the standard errors of the means. (j) Tumor volume of mice in control and futibatinib groups were measured at the last day of vehicle treatment. Bars, error bars, and dots show mean tumor volume (mm3), SEM, and individual tumor volume of each mouse, respectively. C, control; F, futibatinib. (k) Relative tumor growth tumor volume treatment/control ratios (TV T/C ratio) were calculated on day 21. End point tumor volumes (TV) were calculated at the last day of vehicle treatment. Event free survival (EFS) was calculated at the last day of futibatinib treatment. *This model does not have RNAseq data.

