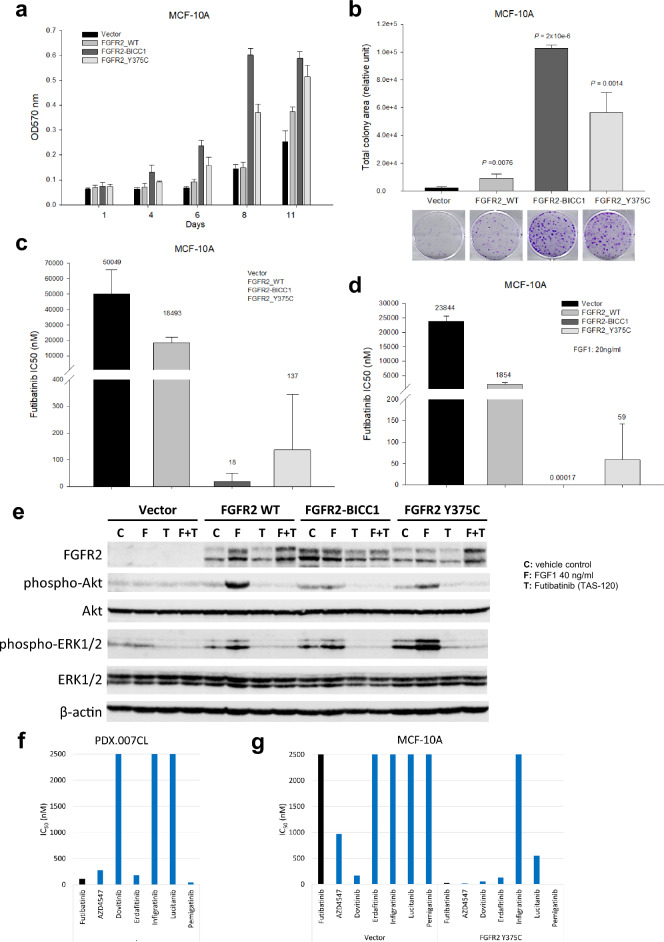
Figure 3.
Effects of FGFR2 alterations on cell sensitivity to fibroblast growth factor receptor (FGFR) inhibitors and FGFR signaling. Normal mammary epithelial MCF10A cells were transduced with FGFR2-BICC1 fusion, FGFR2 Y375C mutation, FGFR2 wild type (WT), and the vector control. (a) Cell viability was measured by a sulforhodamine B (SRB) assay. Bars show the mean OD570 ± the standard errors of the means. (b) Cells were cultured for 3 weeks. Cell colonies were stained, and the total colony area was quantitated. The comparisons of the total colony areas of the FGFR2 WT, FGFR2-BICC1, and FGFR2 Y375C cell lines to the vector control cell line. Bars show the mean total colony areas ± the standard errors of the means. Below, representative stained plates are shown. (c) Cells were and treated with a serial dilution of futibatinib for 4 days. Cell viability was assessed with an SRB assay, and the half-maximal inhibitory concentration (IC50) values were calculated. Bars show the mean IC50 values ± the standard errors of the means. (d) While being starved, cells were treated with fibroblast growth factor (FGF1) for 24 h and various doses of futibatinib for 4 days. Cell viability was assessed with an SRB assay, and IC50 values were calculated. Bars show mean IC50 values ± the standard errors of the means. (e) Cells were starved for 24 h and treated with futibatinib at 0.2 µM for 3 h 45 min, followed by FGF1 for 15 min. Immunoblotting was performed using antibodies against FGFR2, p-Akt (S473), Akt, p-ERK1/2 (T202/Y204), ERK1/2, and β-actin. (f) PDX.007CL cells were plated in spheroid plates and treated a panel of FGFR inhibitors for five days. A luminescence assay was used to determine cell viability and IC50 values were calculated. (g) MCF10A vector control and FGFR2 Y375C cells were treated with a panel of FGFR inhibitors for four days. Sulforhodamine B assay was used to determine cell viability and IC50 values were calculated.

