
Figure 7.
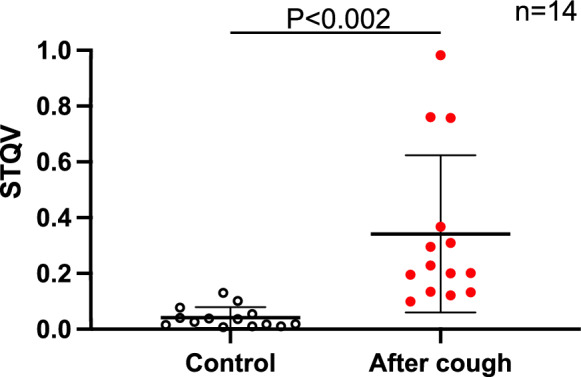
Comparison of the STQV in patients with cough. The STQV pre-treatment and immediately after the onset of coughing in patients who developed cough during MAC (n = 14) was 0.042 ± 0.04 and 0.342 ± 0.038, respectively, indicating that the STQV was significantly higher immediately after the onset of coughing (P < 0.002 [95% CI − 0.47 to − 0.13]. The horizontal line indicates the mean, and error bar indicate standard deviation; analysis was performed using the student’s t-test. STQV stridor quantitative value.