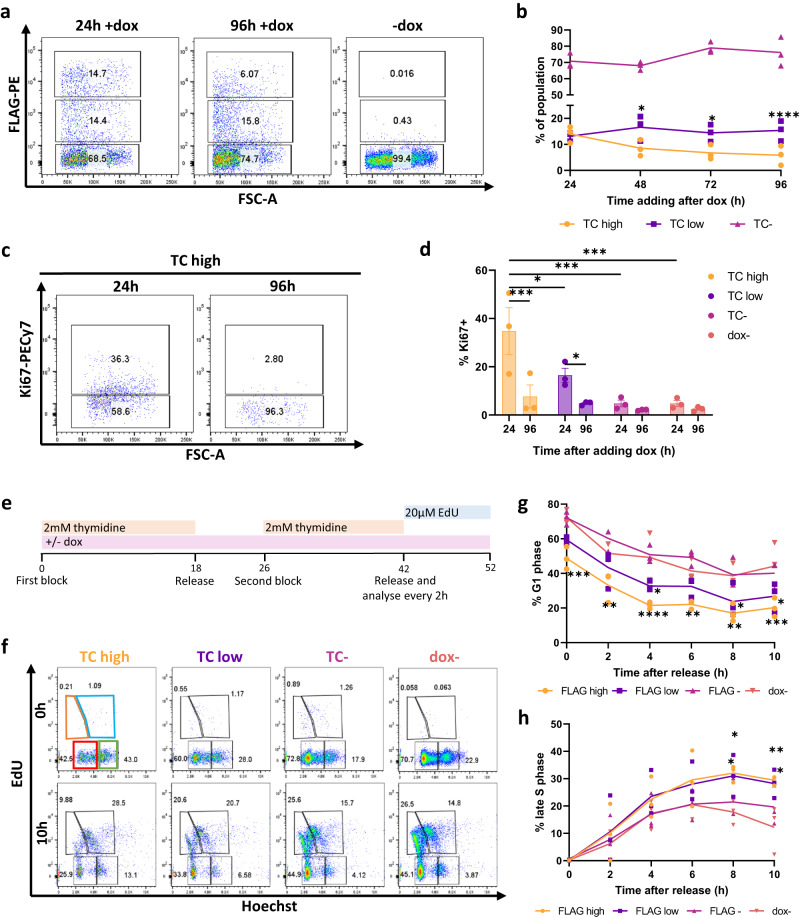
Fig. 1. TC expression in endothelial cells initially results in cell cycle arrest.
a Representative flow cytometry plots showing the frequency of TC expressing cells against FSC-A at 24 h, and 96 h with or without addition of doxycycline (dox) to induce TC expression. b The frequency of TC expressing endothelial cells at 24 h, 48 h, 72 h and 96 h after addition of dox to induce TC expression, as measured by flow cytometry, n = 4. Statistical significance was determined by two-way ANOVA with Tukey’s multiple comparisons test, n = 3. c Representative flow cytometry plots showing the frequency of Ki67+ endothelial cells within the TC high population, at 24 h and 96 h after dox induction. d The frequency of Ki67+ endothelial cells at 24 h and 96 h after dox induction, within TC high, low, negative and uninduced populations, n = 3. Statistical significance was determined by two-way ANOVA with Sidak’s multiple comparisons test. e Experimental timeline showing the double thymidine block protocol for cell cycle synchronisation at the G1/S phase boundary. f Representative flow cytometry plots showing EdU incorporation against Hoechst staining in TC high, TC low, TC- and uninduced endothelial cell populations at 0 h and 10 h after releasing cells from G1/S phase block. This reveals four populations EdU- Ho low (G1 phase; red gate), EdU+ Ho low (early S phase; orange gate), EdU+ Ho high (late S phase; blue gate), and EdU- Ho high (G2 phase; green gate). g Frequency of cells in G1 phase over 10 h following release from thymidine block, in TC high, TC low, TC- and uninduced endothelial cell populations, n = 3. h As (g) but for frequency of cells in late S phase, n = 3. Statistical significance was determined by two-way ANOVA with Dunnett’s multiple comparisons test. In all panels error bars show SEM, and *p < 0.05, **p < 0.01, ***p < 0.001, ****p < 0.0001.

