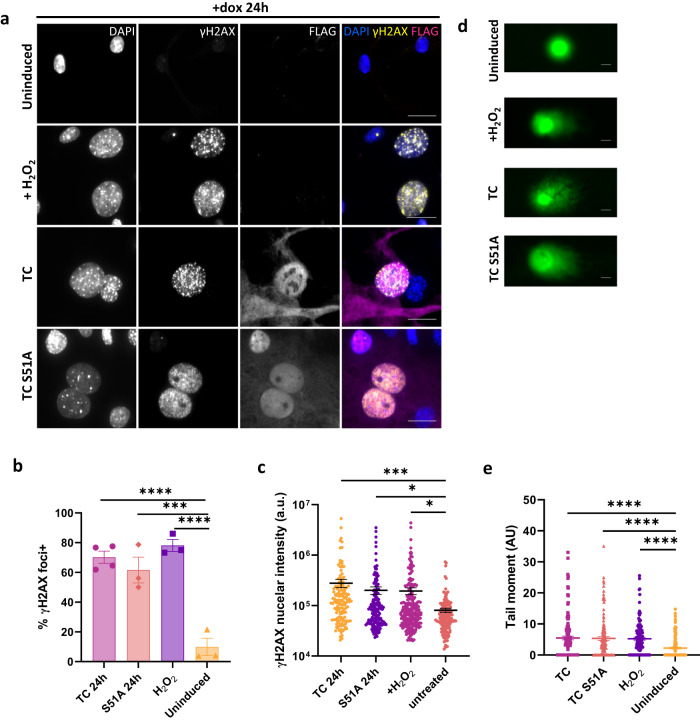
Fig. 2. TC expression causes endothelial cells to accumulate DNA double strand breaks.
a Representative images showing endothelial cells treated with dox for 24 h to induce TC expression or not. Cells treated with 30 μM H2O2 for 4 h were used as a positive control. Cells were stained with DAPI (nuclei; blue), FLAG antibody (TC; magenta), and γH2AX antibody (phospho-H2AX; yellow). All imaging was performed on a Zeiss fluorescence widefield microscope using a 63x oil immersion objective. Scale bars = 20 μm. b Frequency of endothelial cells positive for γH2AX foci from imaging experiments as presented in (a). Cells with more than 10 foci were considered positive. Significance was calculated by one-way ANOVA and Dunnett’s multiple comparisons test. c Nuclear fluorescence intensity of γH2AX staining in cells from the imaging experiments as presented in (a). Significance was calculated by one-way ANOVA and Dunnett’s multiple comparisons test. In imaging experiments, a minimum of 150 cells per condition were analysed, n = 4. d Representative images from neutral comet assay to detect double strand breaks in DNA. Day 10 endothelial cells were either left untreated, incubated with dox for 24 h to induce TC or TC S51A expression, or treated with 30 μM H2O2. Scale bars=10μm. e Graph showing the calculated Olive tail moment from the four conditions in (d). A minimum of 125 cells per condition were analysed. Statistical significance was determined by one-way ANOVA with Sidak’s multiple comparisons test, n = 3. In all panels error bars show SEM, and *p < 0.05, **p < 0.01, ***p < 0.001, ****p < 0.0001.

