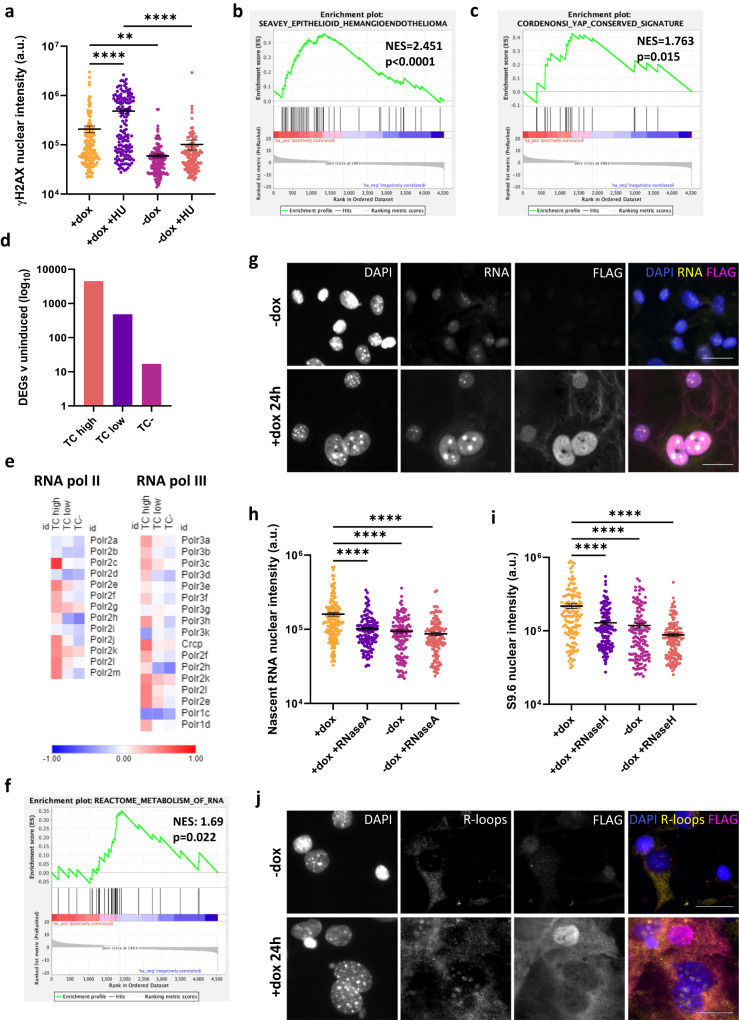
Fig. 3. TC expression mediates hypertranscription and replication stress in endothelial cells.
a Nuclear fluorescence intensity of γH2AX staining in dox treated or untreated endothelial samples, in the presence of hydroxyurea or not. Statistical significance was determined with a one-way ANOVA and Sidak’s multiple comparisons test, n = 3. b GSEA enrichment plots showing significant positive enrichment for the Seavey Epithelioid Haemangioendothelioma gene set in TC high endothelial cells. c GSEA enrichment plots showing significant positive enrichment for the Cordenonsi YAP conserved signature gene set in TC high endothelial cells. d The number of significantly differentially expressed genes (DEGs) determine from RNA-seq data in TC high, TC low and TC- populations when compared to uninduced controls. e Heatmaps showing log2 fold change in RNA expression of RNA polymerase II and III subunits when comparing TC high, TC low and TC- endothelial cell populations to uninduced controls. f GSEA enrichment plots showing significant positive enrichment for the reactome RNA metabolism gene set in TC high endothelial cells. g Representative images showing nascent RNA staining after endothelial cells were incubated with 5-EU for 1 h, and treated with or without dox for 24 h to induce TC expression. Cells were stained for 5-EU (nascent RNA; yellow), DAPI (nuclei; blue) and FLAG (TC; magenta). Imaging was performed on a Zeiss fluorescence widefield microscope using a 63x oil immersion objective. Scale bars = 20 μm. h Fluorescence intensity of nuclear 5-EU staining as shown in (g), to quantify nascent RNA in endothelial samples treated with dox for 24 h or not. RNaseA treatment was used as a negative control. Statistical significance was determined with a one-way ANOVA and Sidak’s multiple comparisons test, n = 3. i Fluorescence intensity of nuclear S9.6 antibody staining as shown in (j), to quantify the presence of R-loops in endothelial samples treated with dox for 24 h or not. RNaseH treatment was used as a negative control. Statistical significance was determined with a one-way ANOVA and Sidak’s multiple comparisons test, n = 3. j Representative images showing S9.6 antibody staining to visualise R-loops in endothelial cells treated with or without dox for 24 h to induce TC expression. Cells were stained for R-loops (yellow), DAPI (nuclei; blue) and FLAG (TC; magenta). Imaging was performed on a Zeiss fluorescence widefield microscope using a 63x oil immersion objective. Scale bars=20μm. In all imaging experiments, at least 145 cells per condition were analysed. In all panels error bars show SEM, and *p < 0.05, **p < 0.01, ***p < 0.001, ****p < 0.0001.

