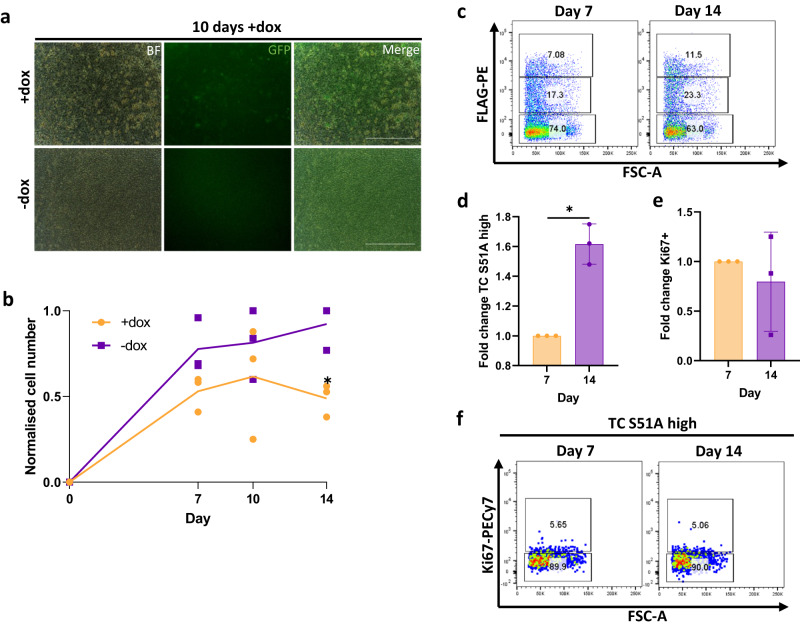
Fig. 6. The interaction of TC and TEAD is required for maintenance of tumorigenesis.
a Representative images showing endothelial cells treated with dox or not to induce TC S51A expression, whereby GFP is a marker for TC S51A, after 10 days exposure to dox. Scale bars=200μm, n = 3. b Normalised cell number in endothelial cells treated with dox or not to induce TC S51A expression, over 14 days, n = 3. Statistical significance was calculated with a two-way ANOVA and Sidak’s multiple comparisons test. c Representative flow cytometry plots showing TC S51A expression against FSC-A at day 7 and 14. d Fold change of TC S51A high population between days 7 and 14 after addition of dox in comparison to uninduced endothelial cells, n = 3. Statistical significance was calculated with a paired t-test. e Fold change of Ki67 expression within the TC S51A high population between days 7 and 14 after addition of dox in comparison to uninduced endothelial cells, n = 3. Statistical significance was calculated with a paired t test. f Representative flow cytometry plots showing Ki67 expression within the TC S51A high population against FSC-A at day 7 and 14. In all panels error bars show SEM, and *p < 0.05, **p < 0.01, ***p < 0.001, ****p < 0.0001.

