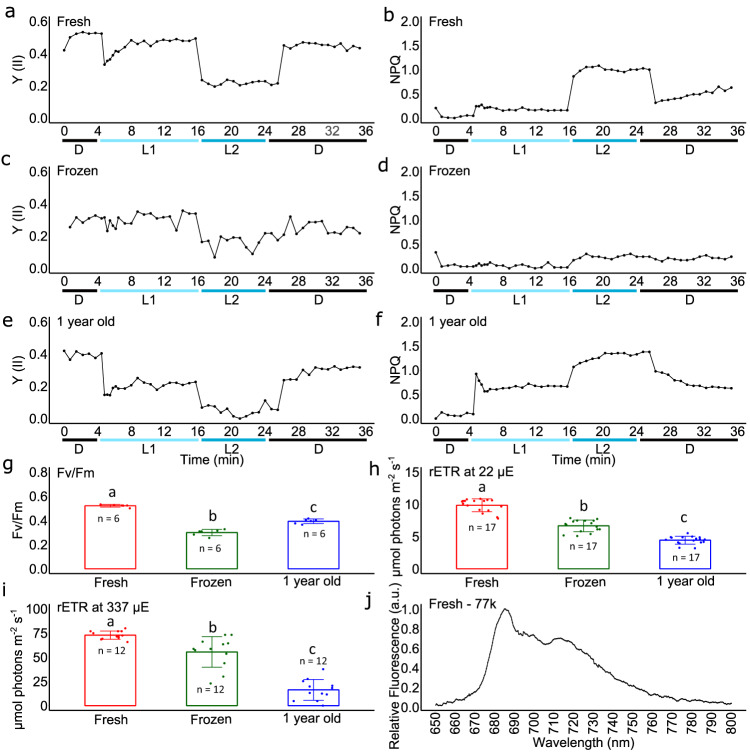
Fig. 2. Analysis of photosynthesis of Sanguina nivaloides collected within red snowfields in Vallon Roche Noire after various periods of conservation.
a, b Effective photochemical quantum yield of photosystem II (Y(II)) and non-photochemical quenching (NPQ) in freshly-collected cells. c, dY(II) and NPQ, in cells frozen 16 hours at -5 °C. e, f Y(II) and NPQ, in cells kept one year at + 4 °C. Prior to the onset of the measurements, cells were acclimated to darkness for 15 min. Chlorophyll fluorescence was recorded under different intensities of actinic light; starting with measurements in the dark (D), then at 22 (L1) and 337 (L2) µmol photons m−2 s−1 followed by 10 min of relaxation in the dark (D). g–i Fv/Fm, and relative photosynthetic electron transfer, rETR, at 22 and 337 µE of freshly collected samples, frozen samples, and samples stored one year at + 4 °C. Fv/Fm, rETR 22 and rETR 337 mean values ± SD were based on n = 6, 17 and 12 independent measurements, respectively. For “fresh vs. frozen” comparisons, the P-value for Fv/Fm measurements based on a One-Way ANOVA test was 2.2 ×10⁻¹¹. For rETR 22 and rETR, 337 measurements, P-values based on a Kruskal-Wallis test were 3.0 × 10⁻¹⁰ and 1.2 × 10⁻⁶, respectively. One-sided ad hoc tests confirmed significant differences, shown with “a”, “b” and “c” letters on the barplots. P-values from Tukey HSD test for Fv/Fm for the samples “fresh vs. frozen”, “fresh vs. 1 year old” and “frozen vs. 1 year old” were 0.1 × 10⁻⁸, 0.1 ×10⁻⁸, and 2.0 × 10⁻⁶, respectively. P-values from Dunn’s test with Boneferroni correction for ETR 22 were 1.2 × 10⁻³, 0.1 × 10⁻⁵, and 1.6 × 10⁻³, respectively. P-values for ETR 337 were 3.3 × 10⁻², 0.1 × 10⁻⁵, and 5.1 × 10⁻³, respectively. j Low temperature fluorescence emission spectrum of a fresh sample of Sanguina nivaloides. The obtained data were normalized to the photosystem II emission peak at 685 nm.

