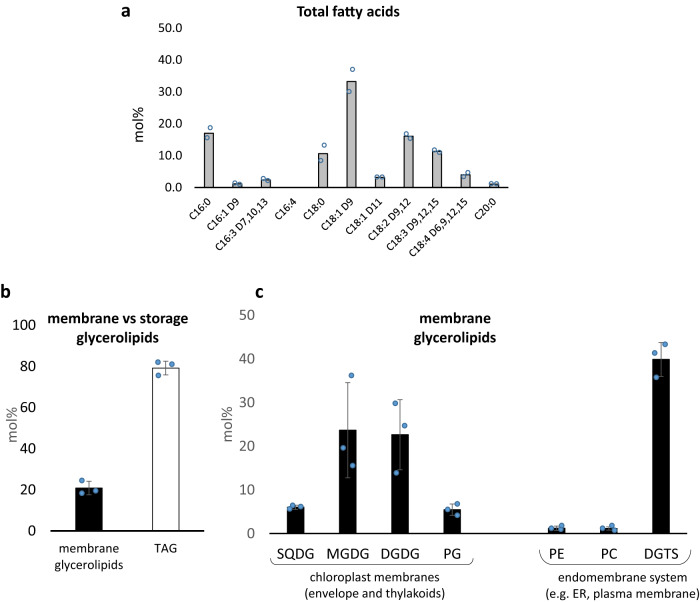
Fig. 6. Quantitative analysis of fatty acids and glycerolipids in S. nivaloides cysts.
a Fatty acid profile in a total lipid extract. Lipids were extracted from S. nivaloides cells collected from bloom 2, and subjected to a methanolysis. Obtained fatty acid methyl esters were identified by mass spectrometry and quantified by gas chromatography coupled to flame ionization detection. Fatty acids are represented based on their carbon-chain lengths (from 16 to 20 carbon), and the positions of double bonds (Dx, numbered at the xth carbon from the carboxylic end). Relative proportions are expressed in mol%. The result is the average of two replicates. b Relative proportions of membrane and storage glycerolipids. Relative proportions are expressed in mol% of total glycerolipids. c Relative proportions of membrane glycerolipid classes. Relative proportions are expressed in mol% of membrane glycerolipids. Profiles shown in (b) and (c) were obtained from lipids extracted from bloom 4. Each result is the average of three replicates ± SD. DGDG digalactosyldiacylglycerol, DGTS diacylglyceryl-trimethylhomoserine, MGDG monogalactosyldiacylglycerol, PC phosphatidylcholine, PE phosphatidylethanolamine, PG phosphatidylglycerol, SQDG sulfoquinovosyldiacylglycerol, TAG triacylglycerol.

