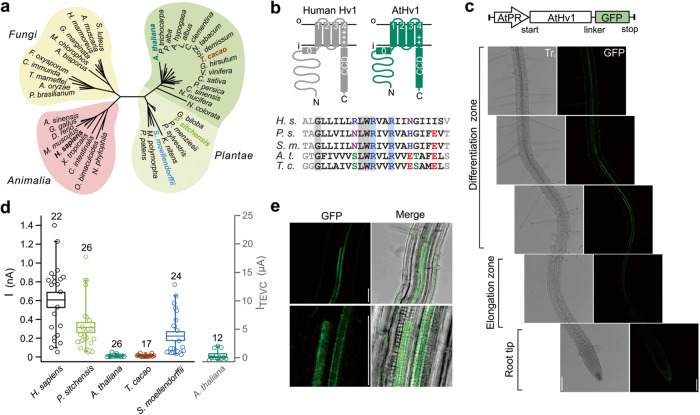
Fig. 1. Plant Hv channels: AtHv1 expression in Arabidopsis and Xenopus oocytes.
a Cladogram showing the relationship between plant Hvs and homologs from animals and fungi. Angiosperm channels, including AtHv1, form a cluster (darker shade) distinct from other plant Hvs. b Predicted membrane topology of AtHv1 compared to human Hv1 (H.s.). Alignment of S4 segments of plant Hvs highlights conserved positively charged residues. c AtHv1 expression in Arabidopsis assessed by confocal fluorescence microscopy. In the imaged transgenic plants, the translation of GFP-tagged protein is controlled by the genomic promoter region AtPR. Strongest signal was detected from the stele (where vascular tissue is located) at the transition between differentiation and elongation zones. Gray-scale images: bright field light. Scale bars: 100 µm. d Magnitude of proton currents (I) measured in inside-out patches from Xenopus oocytes expressing Hv channels from the indicated species. Test potential: 80 mV, holding potential: −60 mV, pHi = pHo = 6.0. Current measured in TEVC (ITEVC) from cells expressing AtHv1 is shown on the right. Test potential: 80 mV, holding potential: −50 mV. Numbers of biologically independent measurements (n) for the individual channels are shown atop box plot. Boxes indicate means ± SE. Whiskers show 5th and 95th percentiles. Source data are provided as a Source Data file. e Magnification of the root vasculature in the differentiation zone expressing GFP-tagged AtHv1. Merge panels combine light transmission and confocal images. Scale bars: 50 µm (top and bottom). Confocal images shown in (c) and (e) are representatives of three distinct transgenic lines (see Fig. S1).

