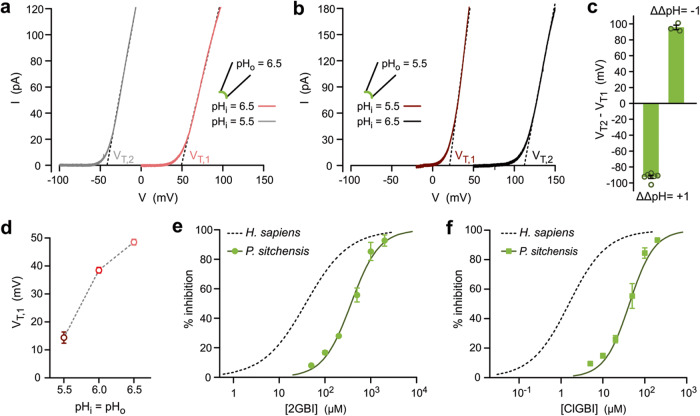
Fig. 3. ΔpH dependence of PsHv1 gating and sensitivity to arginine mimics.
Representative I–V relationships for PsHv1 showing shifts in VT in response to changes in ΔpH from 0 to 1 (a), and from 0 to −1 (b). Voltage was changed using ramp protocols described in “Methods”. c Average shifts in VT as a function of change in ΔpH (ΔΔpH) measured from I–V s like those shown in (a, b). Each bar represents the mean of n biologically independent measurements ± SEM (n = 6 and 3 for ΔΔpH = 1 and −1 respectively). d VT,1 of I–Vs from PsHv1 as a function of pH in the absence of gradient (ΔpH = 0). Each point is the mean of n biologically independent measurements (n = 5, 5, and 6 for pH = 5.5, 6.0 and 6.5, respectively). Error bars are SEM. Concentration dependence of inhibition of PsHv1-mediated currents by arginine-mimic compounds 2GBI (e) and ClGBI (f). Currents were activated by depolarization to 120 mV in inside out patches (pHi = pHo = 6.0). The compounds were perfused in the bath solution at the indicated concentrations. Each point is the mean of n biologically independent measurements ± SD (n = 5, 4, 4, 4, 4, and 3 for 50, 100, 200, 500, 1000, 2000 µM 2GBI, respectively, and n = 3, 5, 4, 5, 5, and 3 for 5, 10, 20, 50, 100, and 200 µM ClGBI, respectively). Hill fits of data points are shown as curved solid lines. Fit parameters are: IC50 = 372 ± 28 µM and h = 1.42 ± 0.13 for 2GBI, and IC50 = 39 ± 8 µM and h = 1.46 ± 0.27 for ClGBI. Inhibition curves for hHv1 are shown as dashed lines for reference, from ref. 51. Source data are provided as a Source Data file.

