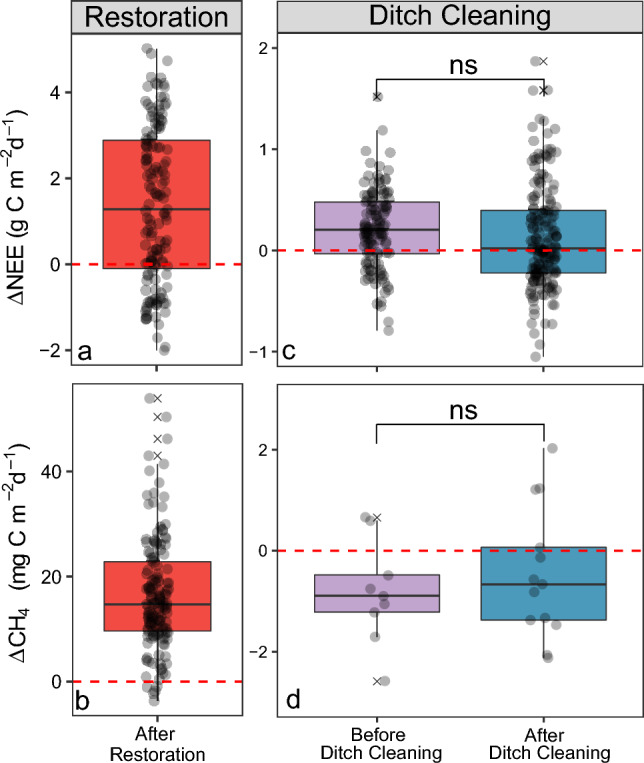
Figure 4.

Difference in the daily sums of the ecosystem-scale exchange of CO2 (NEE, a and c) and methane (CH4; b) as well as plot-scale (CH4; Δ fluxes (d) over one growing season (mid-May to mid-October) following restoration (a and b) and before and after ditch cleaning (c and d). The difference is computed as treatment minus control. Black circles represent individual data points. “n.s.” denotes no significant (p > 0.05) difference between treatments. Red dotted line denotes the control zero reference. Solid line in box plots is the median value, box extents are the interquartile range (IQR) and whiskers show the 1.5IQR value. Note that the scales for the y-axes show different magnitudes of fluxes.
