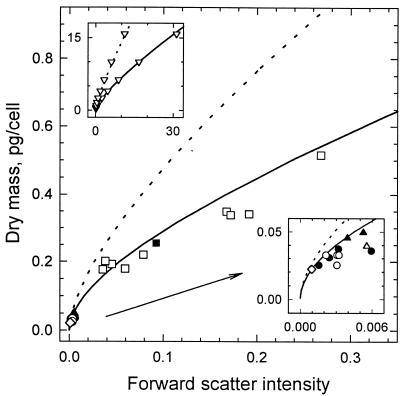
FIG. 2.
Standard curves for dry mass. Curves were computed for cells with an axial ratio of three and with linear (——) and random (·····) orientations in the flow stream (37) and were calibrated with the dry mass measurement for C. oligotrophus (◊). Data are from light scatter intensities of C. oligotrophus (• and ○), Marinobacter sp. strain T2 (▴ and ▵), and E. coli (■ and □), with dry weights computed from Coulter Counter volumes corrected for cell density on the basis of equations 1 and 3. Closed symbols are for data in Table 4; open symbols are for additional data. The upper inset shows data generated from Rayleigh-Gans theory (▿) and fitted curves and extends computations to larger particle sizes. The lower inset expands data from small organisms.

