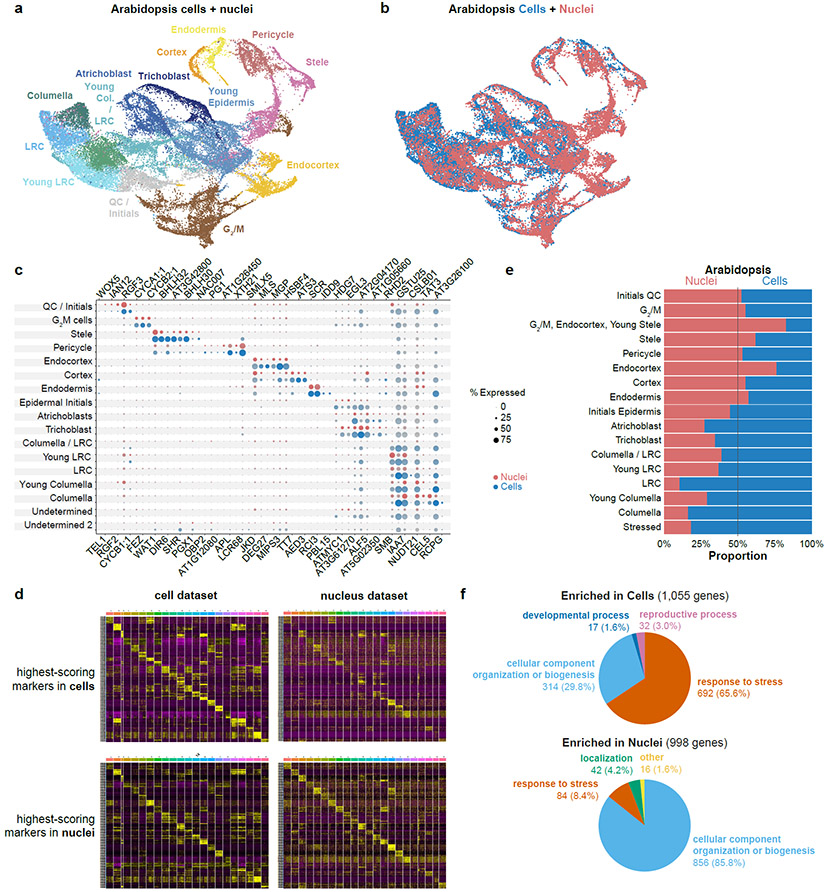
Fig. 1: Cell and nucleus profiles identify the same markers but show different sensitivities and artifacts.
a, b UMAP of combined Arabidopsis cells and nuclei with clusters colored according to assigned cell identity (a) or cell vs. nuclei origin (b). c Dot plots of Arabidopsis marker genes in cells (blue) or nuclei (red), showing all the cell types defined from clusters in this study. d Heatmaps of the 10 highest-scoring marker genes for each cell type found using Seurat. Upper row shows highest scoring markers found in the single-cell dataset (left) with their expression in the single nucleus dataset shown (right). Lower row shows highest-scoring markers found in single nucleus dataset (left) and their expression in the single cell dataset (right). e Proportion cells vs nuclei present in each cell type cluster. f Pie charts showing the difference in the prevalence of Gene Ontology (GO) terms among differentially expressed genes in each cluster between cells (top) vs. nuclei (bottom).

