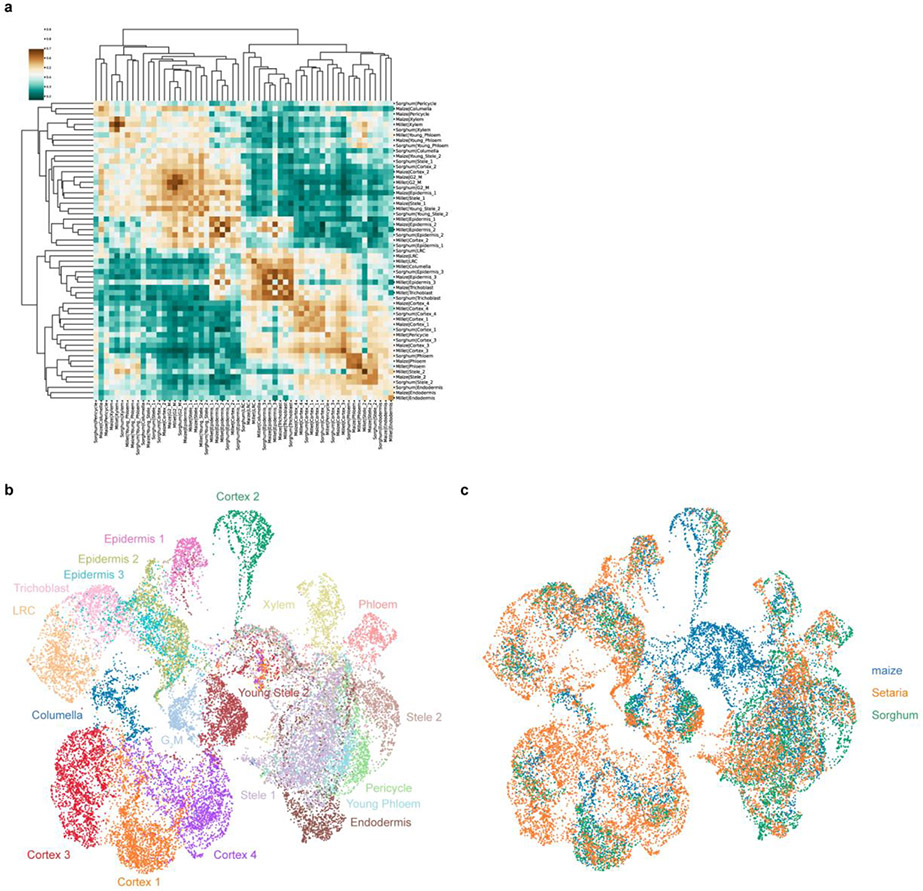
Extended Data Fig. 6: Analysis of overall expression similarity among all cellular and nuclear clusters in the three monocot species studied.
a AUROC test comparing every cell type in all species for both cell and nuclei datasets, showing that clusters discovered in either cell or nuclei group by like cell type and not by either species or source of material (cells or nuclei). b-c UMAPs generated by additional integration of the dataset using a Python supervised integration method scGen. This method uses a variational autoencoder to learn the underlying latent space for the cell types. b Different colors represent the clusters identified by the Seurat integration mapped onto the new scGen integration, showing Seurat classification was in relative agreement with the scGen classification. i.e., scGEN clusters have relatively homogenous coloration. c The same UMAP as in (b), this time showing the species distribution. Overall, each cluster has cells from each of the three species.

