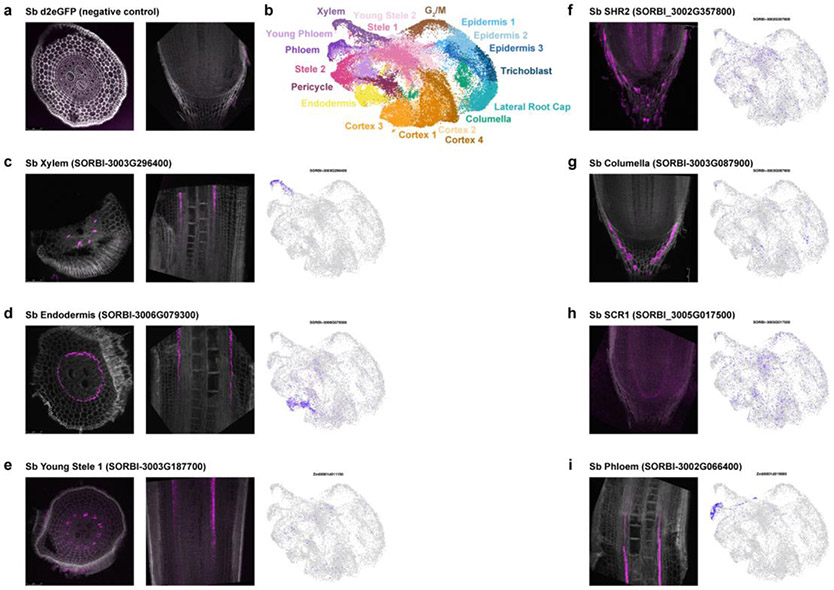
Extended Data Fig. 8: In-situ hybridization corroborates evidence for localization of marker gene expression from single-cell RNA-seq profiles in sorghum.
a-i In situ hybridization using Hairpin Chain Reaction (HCR) probes labeling various transcripts. Cross sections are on the left and longitudinal sections on the right (a,c,d,e). Longitudinal sections are shown in (f,g,h,i). UMAPs showing each transcript’s cluster localization are shown next to each probe’s fluorescent image. The minimum/maximum values for each fluorescence channel (grey: autofluorescence, magenta: HCR probes) have been adjusted to show the localization more clearly in the merged image.

