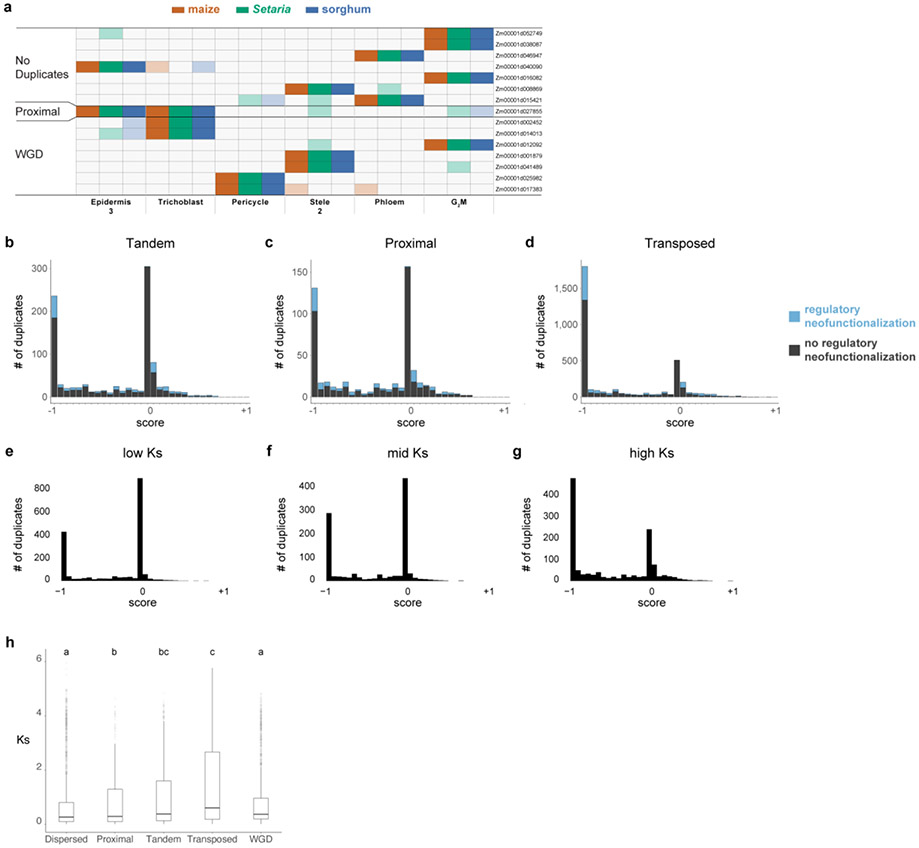
Extended Data Fig. 9: Regulon conservation across species, and distribution of gene pair expression patterns.
a Conserved regulons found using MINI-EX and their pattern of expression. The regulon is labeled by the transcription factor that putatively regulates it in each row. b-d Distribution of genes pairs on the dominance vs. regulatory subfunctionalization scale for transposed, tandem and proximal duplicate pairs. In blue, neofunctionalized duplicates are shown as a percentage of the bar. e-g Distribution on the dominance to regulatory subfunctionalization scale for dispersed gene duplicate pairs binned in thirds by their Ks value. The graphs suggest that duplicates tend to lose co-expressed patterns and gain dominance over time. h Boxplot of Ks values showing the distribution among all the duplicate classes used in the analysis. In h, statistical analysis was performed using a Kruskal-Wallis one-way ANOVA followed by the Tukey test for all pairwise comparisons. Not sharing a letter represents statistical significance at p < 0.05. In boxplots the middle line is the median, the lower and upper hinges correspond to the first and third quartiles (Q1,Q3), extreme line shows Q3+1.5xIQR to Q1-1.5xIQR (interquartile range-IQR). Dots beyond the extreme lines shows potential outliers. h. n=10,104 WGD, n=860 Proximal, n=3,154 Transposed, n=7,552 Dispersed, n=1,448 Tandem.

