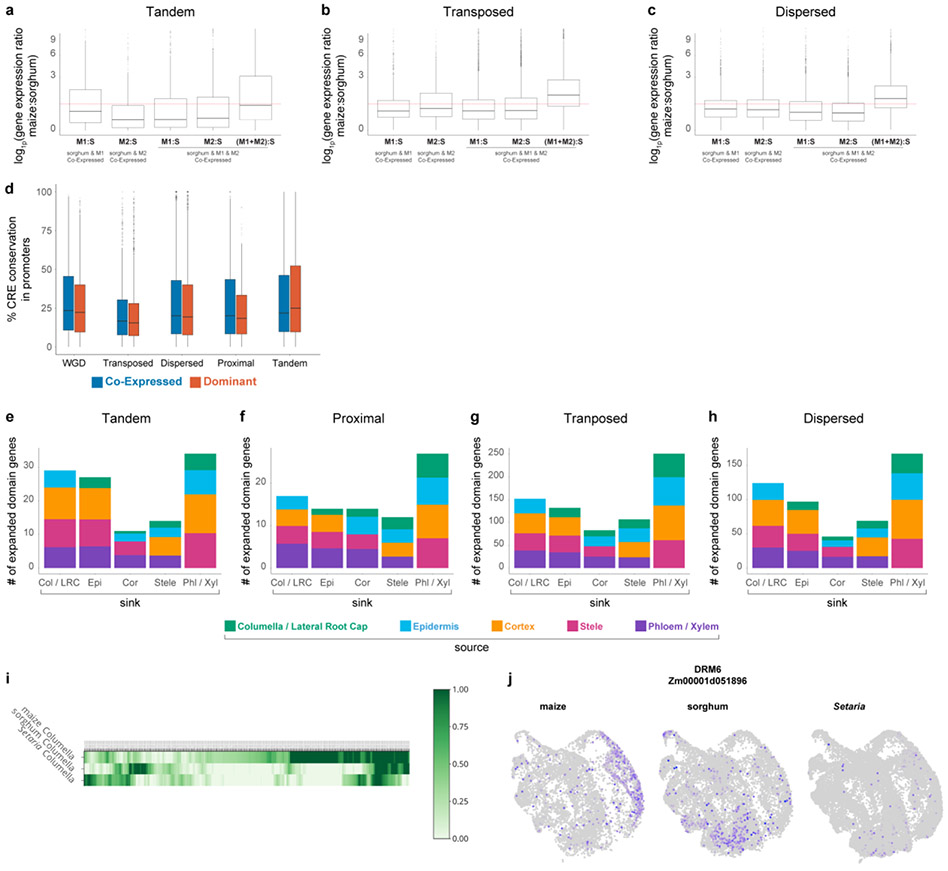
Extended Data Fig. 10: Overall analysis of expression conservation in duplicate classes and analysis of columella expression across species.
a-c Dosage compensation analysis representing the expression ratios of maize over sorghum orthologous genes in tandem, transposed, and dispersed duplicate pairs. The first two boxplots represent cases in which a sorghum ortholog is expressed in the same homologous cell type as only a single maize duplicate (either M1 or M2). The third and fourth boxplots represent cases in which both homeologs are expressed in the same cell and a sorghum homolog is expressed in a homologous cell type. The last boxplot shows the ratio when both of the co-expressed homeologs are added together in the numerator, showing a mean ratio close to 1. The higher expression in the first two boxplots compared to the second two indicates dosage compensation. d Conservation rate of cis-regulatory elements between WGD homeolog pairs in promoters. The plot shows no major differences between co-expressed and dominant gene pairs, and no major differences among the different classes of duplication. e-h Distribution of maize genes displaying regulatory neofunctionalization of expression into new cell types. Colors signify the cell type of origin. i Heatmap of maize columella markers, with the orthologous gene expression in the maize cluster of the other two species. j Example of the gene DMR6 switching its expression between columella in maize to epidermis / cortex in sorghum. a-c, statistical analysis was performed using ANOVA followed by the Tukey test for all pairwise comparisons, Not sharing a letter represents statistical significance at p < 0.05. In boxplots the middle line is the median, the lower and upper hinges correspond to the first and third quartiles (Q1,Q3), extreme line shows Q3+1.5xIQR to Q1-1.5xIQR (interquartile range-IQR). Dots beyond the extreme lines shows potential outliers. a-h: n=10,104 WGD, n=860 Proximal, n=3,154 Transposed, n=7,552 Dispersed, n=1,448 Tandem.

