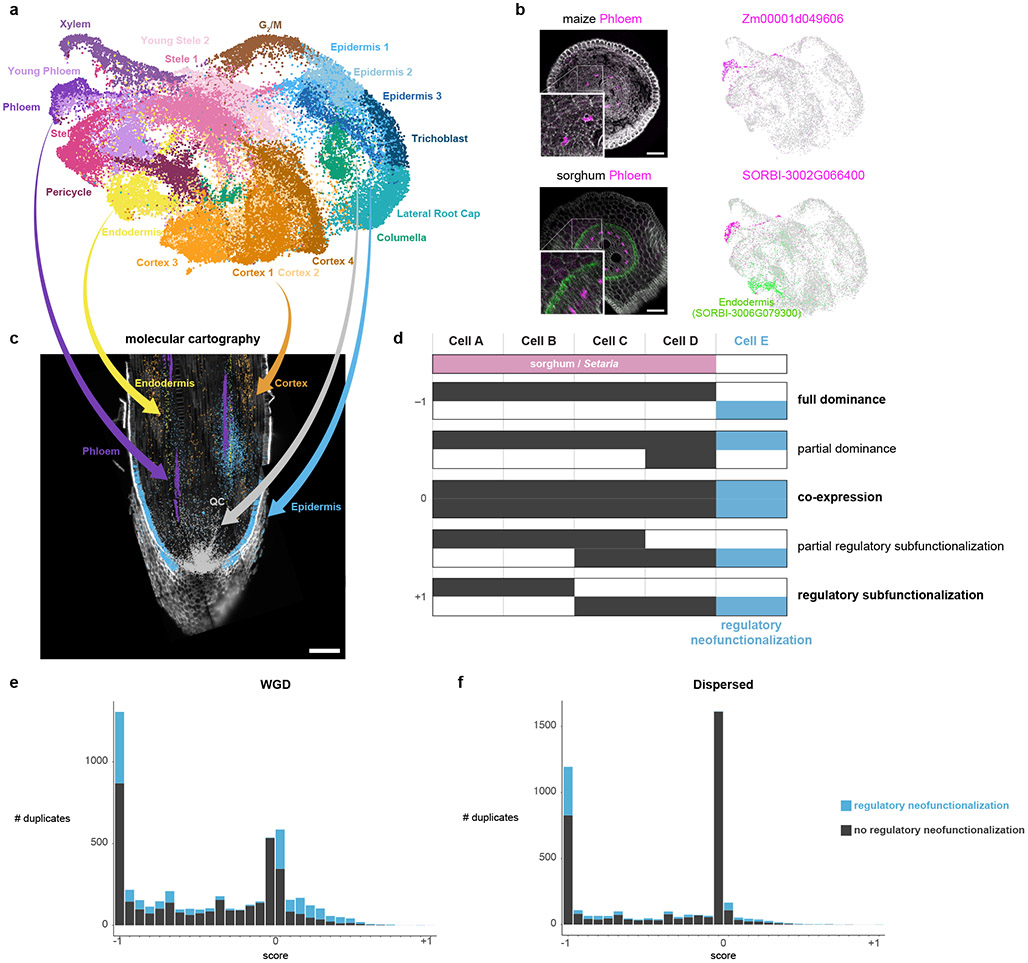
Fig. 2: Mapping cell identities from maize to sorghum and gene duplicate analysis.
a UMAP of combined maize cell and nucleus profiles. Clusters are colored and labeled according to cell identity. b In-situ hybridization in maize (top) and sorghum (bottom). The maize phloem marker is orthologous to the sorghum phloem marker. Cyan coloration in the lower panel corresponds to a sorghum endodermal marker that highlights the stele boundary. The minimum/maximum values for each channel in the fluorescence images have been adjusted to show the localization more clearly in the merged image. UMAPs next to images show the respective expression of each gene in the maize-sorghum co-clustered single-cell profiles, which were used initially to determine their expression pattern. c Molecular Cartography, which allows simultaneous hybridization of multiple probes to a tissue section, here showing markers used for the cell-cluster annotation of clusters in maize. d Conceptual schematic of hypothetical expression patterns between duplicate gene pairs following a metric with a scale ranging from full dominance (−1) to equal co-expression (0) to regulatory subfunctionalization (1). Example intermediate states are also shown. Blue shows regulatory neofunctionalization. e-f Distribution of duplicate gene expression patterns using the metric described in (d) for WGD homeologs (e) and dispersed duplicate (f) pairs having similar with median Ks. Number of genes: 10,104 (WGD homeologs); 7,552 (dispersed duplicates).

