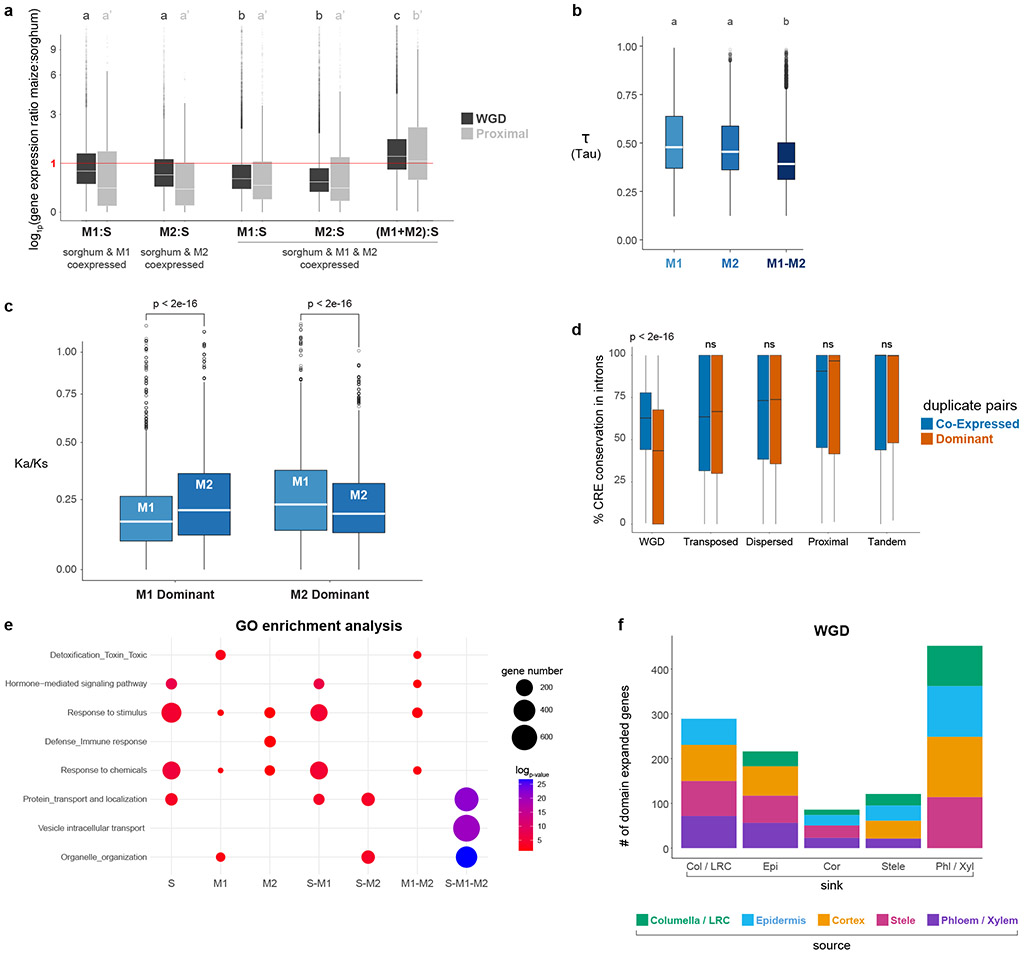
Fig. 3: Detection of dosage compensation and cellular destination of regulatory neofunctionalized genes.
a Dosage compensation analysis with expression ratios of maize over sorghum orthologous genes in the two duplication classes. The first two boxplots represent cases where a sorghum ortholog is expressed in the same cell type as a single maize homeolog (either M1 or M2). The third and fourth boxplots represent cases in which both homeologs are expressed in the same cells. The last boxplot shows the ratio when both of the co-expressed homeologs are added in the numerator over sorghum expression level in the denominator. Dosage compensation is inferred from a pattern in which lone expression of a homeolog is higher than co-expressed homeologs. b Tau () value reflecting degree of cell specificity in different expression categories within a cell, if M1 or M2 is dominant or if M1 and M2 are co-expressed. c Ka/Ks distribution of WGD homeologs, when either M1 or M2 is dominant in a cell type they display stronger purifying selection than the non-dominant homeolog. d Cis-regulatory element conservation rate between duplicate pairs in introns split into co-expressed and dominant categories. e GO-terms enriched within each category expression category. S, M1, M2 = unique expression of the sorghum ortholog or one maize homeolog. S-M1 or S-M2 = one maize homeolog expressed in the same cell type as the sorghum ortholog. S-M1-M2 = both homeologs expressed in the same cell type as the sorghum ortholog. f Regulatory neofunctionalized genes categorized by their new expression domains. Colors within a bar graph show their ancestral cell-type domain (Methods). In a-d, n=10,104 WGD, n=860 Proximal, n=3,154 Transposed, n=7,552 Dispersed,n=1,448 Tandem. In a,b, statistical analysis was performed using an one-way ANOVA followed by the Tukey test for all pairwise comparisons, Not sharing a letter represents statistical significance at p < 0.05, in c Wilcoxson test, two-sided, in d, Wilcoxon signed-rank test, two-sided, with pvalue adjusted with Benjamini & Hochberg (1995) (BH). In boxplots the middle line is the median, the lower and upper hinges correspond to the first and third quartiles (Q1,Q3), extreme line shows Q3+1.5xIQR to Q1−1.5xIQR (interquartile range-IQR). Dots beyond the extreme lines shows potential outliers.

