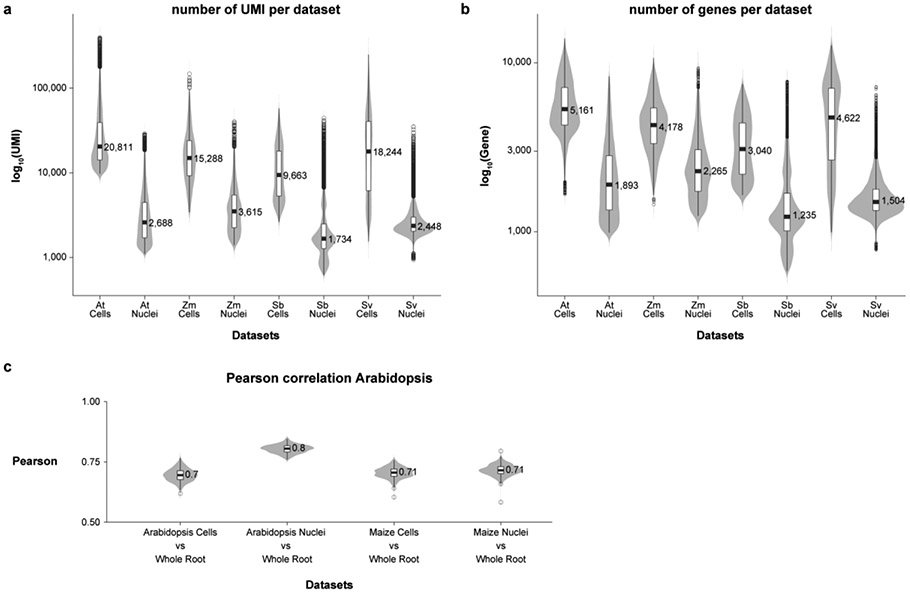
Extended Data Fig. 1: Quality control and fidelity analysis of RNA-seq profiles using violin plots.
a Distribution of the number of UMI detected among cells vs. nuclei. b Distribution of the number of genes detected among cells vs. nuclei. c Pearson correlation distributions of gene expression from single-cell or single-nucleus compared to whole-root RNAseq data in Arabidopsis and maize. The distributions are derived by randomly sampling 2,000 genes for correlation analysis between cells and nuclei. The random sampling was repeated 250 times to generate the distribution of correlation values. Violin plots display show the kernel probability density of the data at different values, boxplot inside display as the middle black line is the median, exact media is displayed on the graphs, the lower and upper hinges correspond to the first and third quartiles (Q1,Q3), extreme line shows Q3+1.5xIQR to Q1-1.5xIQR (interquartile range-IQR). Dots beyond the extreme lines shows potential outliers.

