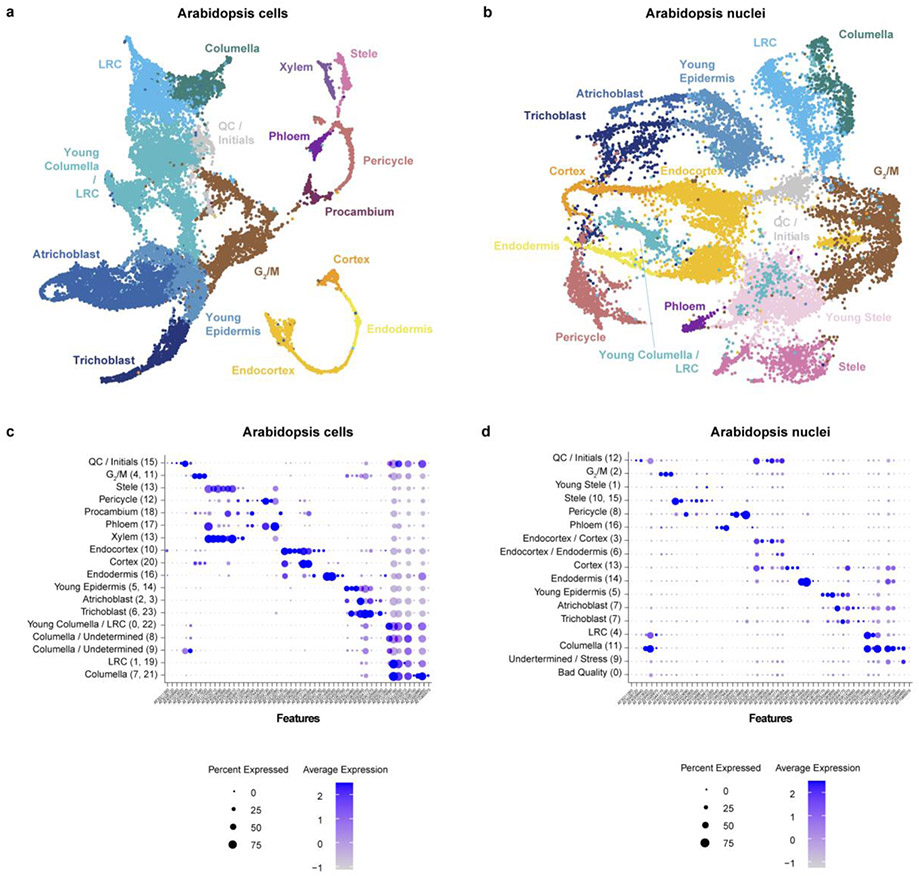
Extended Data Fig. 2: Evaluation of agreement in nuclear and cell type profiles.
a, b UMAP clustering in Arabidopsis single-cells (a) and single-nuclei (b) clustered independently, showing clusters with the same diagnosed cell identities. c, d Dot plots showing expression levels per cluster and expression in percent of cells of the same set of cell-type specific markers in cells (c) or nuclei (d). The markers are in the same order in both plots.

