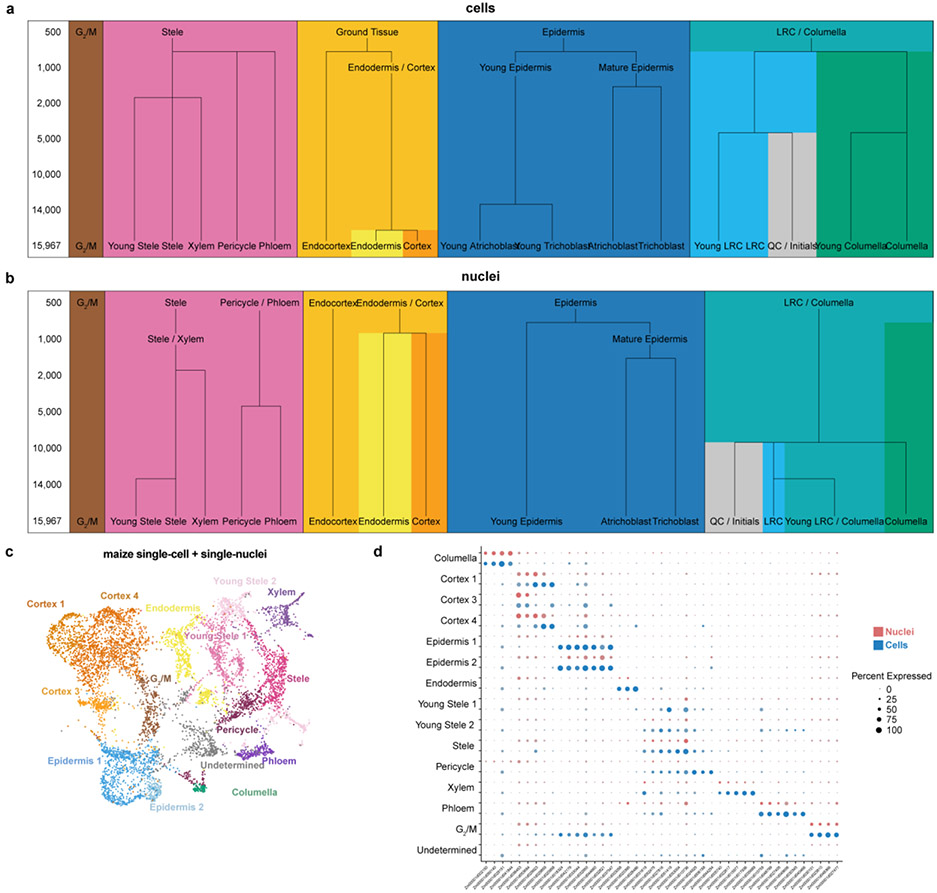
Extended Data Fig. 3: Analysis of sensitivity of nuclear and cell profiles in distinguishing clusters and identifying markers.
a Arabidopsis down sampling analysis shows the number of cells needed to resolve different clusters. A branch signifies that a new cluster with a known cell type identity was distinguished at a given sample size. b A similar analysis using the single nucleus RNA-seq dataset, showing that more nuclei are needed to resolve the same number of clusters compared to cells in (a). Tracking the branches of graphs in (a) vs. (b) leads to a rule-of-thumb that two-fold more nuclei than cells are needed to identify clusters. c UMAP of the combined maize single-cell and -nuclei datasets, clusters are colored by cell type identity. d Dotplot of maize marker genes in cells (blue) or in nuclei (red), showing overall concordance of marker gene expression in the two datasets.

