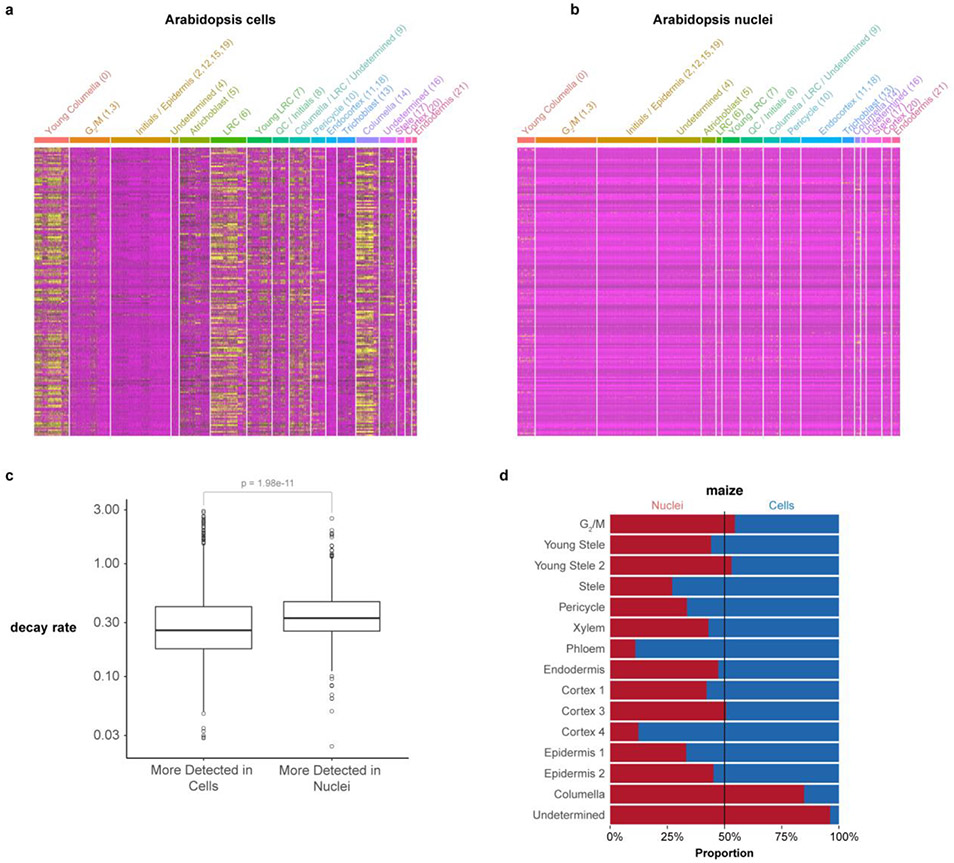
Extended Data Fig. 4: Analysis of differentially regulated genes and cell capture efficiency in nuclear vs. cellular profiles.
a, b Heatmaps of genes known to be induced by protoplast generation (Birnbaum et al., 2003) showing their expression in cells (a) vs. nuclei (b). The analysis shows that stress-induced genes also have higher expression in cells vs. nuclei, with a bias in specific cell types. c Distribution of expression levels of genes annotated for mRNA decay in cells or in nuclei, decay values from Sorenson et al., 2018. A significant increase in expression of mRNA decay-related genes was detected in nuclei, (n=1965 genes, Wilcoxon rank sum test, two-sided, p-value = 1.98e-11), the boxplots display the middle line is the median, the lower and upper hinges correspond to the first and third quartiles (Q1,Q3), extreme line shows Q3+1.5xIQR to Q1-1.5xIQR (interquartile range-IQR). Dots beyond the extreme lines shows potential outliers. d Proportion of cells vs nuclei present in each cell type cluster.

