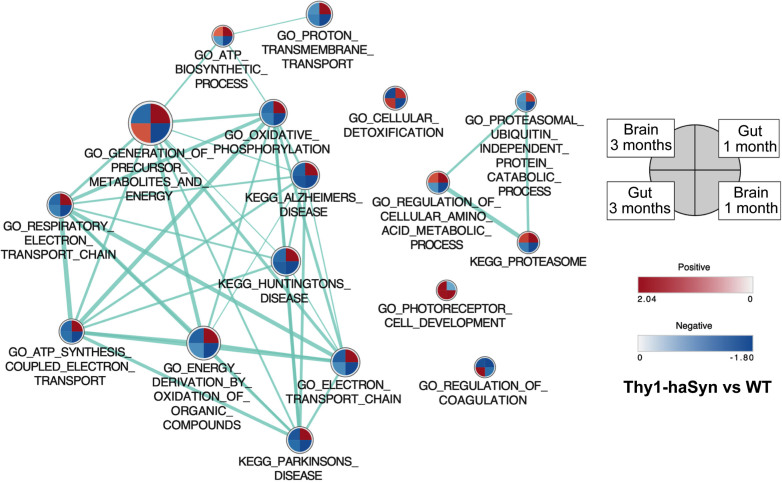
Fig. 2.
PD-relevant gene sets have opposite enrichment in colon and striatum. Normalized enrichment scores are shown for Thy1-haSyn vs. WT in colon and striatum at one and three months. Sets shown are selected from those that are significant for any comparison at the GSEA-recommended significance cutoff of FDR q value < 0.25 (Table 2). Each circle represents a gene set with the quadrants corresponding to the different tissues and time points. The shading of the quadrant reflects the enrichment score in Thy1-haSyn vs. WT at that time in that tissue, with darker shading indicating a larger enrichment score. Quadrants with a “+” represent positive enrichment scores while those without this annotation are negative enrichment scores (gene set was enriched in WT). Samples sizes are shown in Table 1. Thy1-haSyn, alpha-synuclein overexpressing; WT, wild type; NES, normalized enrichment score.

