Fig. 3.
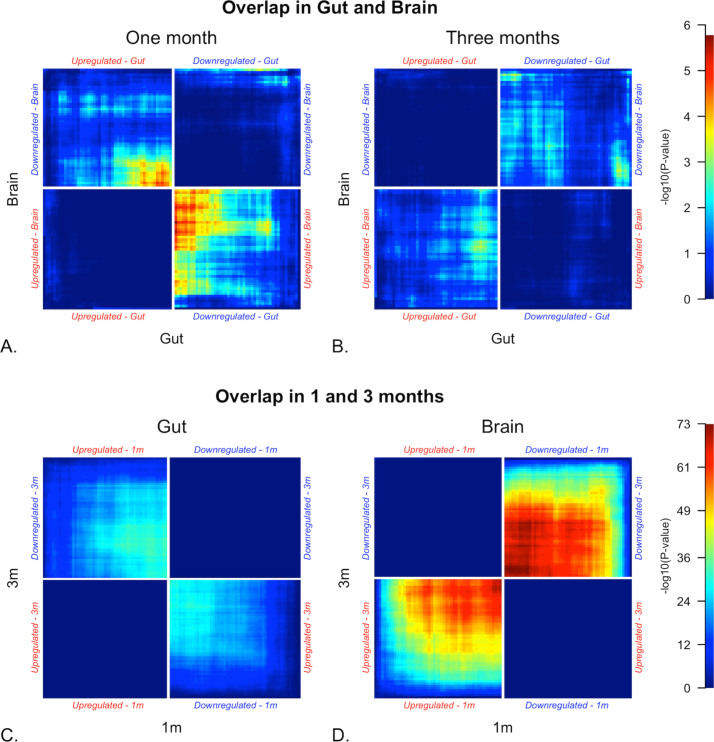
Rank-rank hypergeometric overlap (RRHO) heatmaps. RRHO identifies concordant/discordant differential gene expression between data sets by identifying enrichment of DEGs from one set within DEGs from another. All genes were ranked by -log10 p value multiplied by the effect sign (1/-1 for upregulated/downregulated). The plot is a heatmap of unadjusted p-values for overlap of DEGs (Thy1-haSyn vs. WT) between tissues and between time-points within tissue. For each plot, bright areas represent concordant (top right and bottom left quadrants) and divergent (top left and bottom right quadrants) differential gene expression (Thy1-haSyn vs. WT) between colon and striatum at one month (A) and three months (B), and between one month and three months in colon (C) and striatum (D). This analysis also shows that patterns of differential expression are discordant in the colon and striatum at one month. In addition, while there is high concordance between differential expression in striatum and 1 and 3 months, there is slight discordance in the colon. p-values are unadjusted; plots with adjusted p values (Benjamini-Yekutieli) are shown in Supplementary Figure 4. Samples sizes are shown in Table 1.

