Fig. 3.
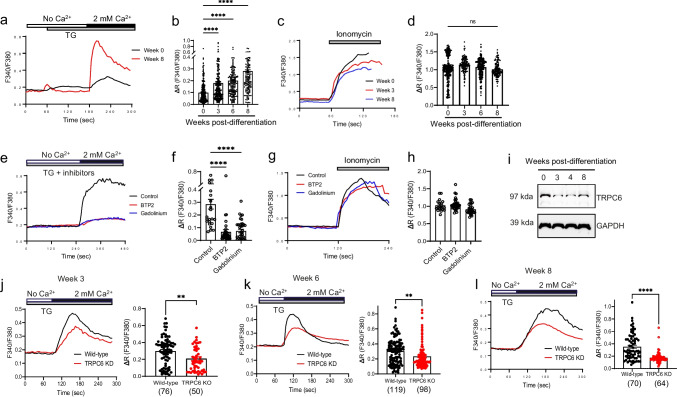
Downregulation of SOCE in TRPC6 KO hPSC-derived cortical neurons. a Representative calcium trace of Fura-2 F340/F380 ratio for SOCE responses by TG that depletes ER calcium store and leads to activation of SOCE; 0 week (black line) and 8 weeks (red line) of differentiation. b The net increase of calcium level by SOCE activation in hPSC-derived cortical neurons differentiated for 0 (n = 297), 3 (n = 283), 6 (n = 195), and 8 (n = 182) weeks. Data are means ± SEM and number of cells tested is shown from 5 ~ 6 independent differentiation. c Representative calcium trace of Fura-2 F340/F380 ratio in ionomycin-treated cortical neurons. d The net increase of calcium level by ionomycin treatment as a control. Data are means ± SEM and number of cells tested is shown from 5 ~ 6 independent differentiation (n = 297, week 0; n = 134, week 3; n = 228, week 6; n = 130, week 8). e, f Representative calcium trace of SOCE in 8-week-old cortical neurons in the presence of 10 µM BTP2, a selective TRPC inhibitor, or 5 µM gadolinium (Gd3+), a non-selective cation channel blocker. Data are means ± SEM and number of cells; n = 25, 38, 35. Welch and Brown–Forsythe one-way ANOVA test with Games–Howell (b) or Dunnett T3 (d, f) was used. ****, p < 0.0001; ns, not significant. g, h Calcium increase in ionomycin-treated cortical neurons in the presence of BTP2 or Gd3+. Data in f, h are means ± SEM and number of cells; n = 18, 33, 28. i TRPC6 expression in hPSC-derived cortical neurons differentiated for 0, 3, 4, and 8 weeks. j–l TRPC6 KO reduces SOCE. Representative calcium trace of Fura-2 F340/F380 ratio (left) and quantification of net calcium increase (right) in hPSC-derived (C21 hPSC line) cortical neurons differentiated for 3 (j), 6 (k), and 8 (l) weeks. Data in j–l are means ± SEM and number of cells tested is shown in parentheses from 2 independent differentiation and unpaired two-tailed t-test was used. **, p < 0.01. ****, p < 0.0001

