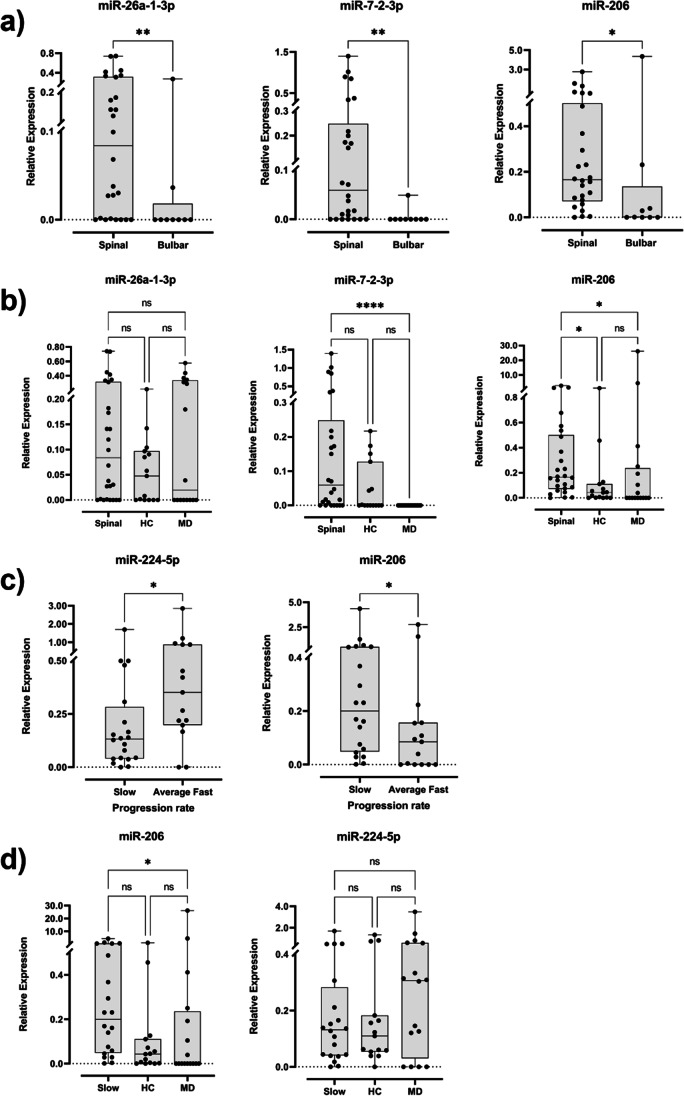
Fig. 4.
Box and whisker plots of relative expression of the statistically differently expressed miRNAs detected in a spinal (N = 26) and bulbar (N = 9) onset patients, b spinal onset patients and control groups, where HC and MD stand for healthy and ALS-mimic diseases control groups respectively, c progression rate (N (slow) = 20, N (average fast) = 15) and d slow progression patients and control groups. Dots represent mean relative expression values of each sample. Statistical significance calculated using Kruskal-Wallis test and Dunn’s multiple comparisons test. *p value < 0.05

