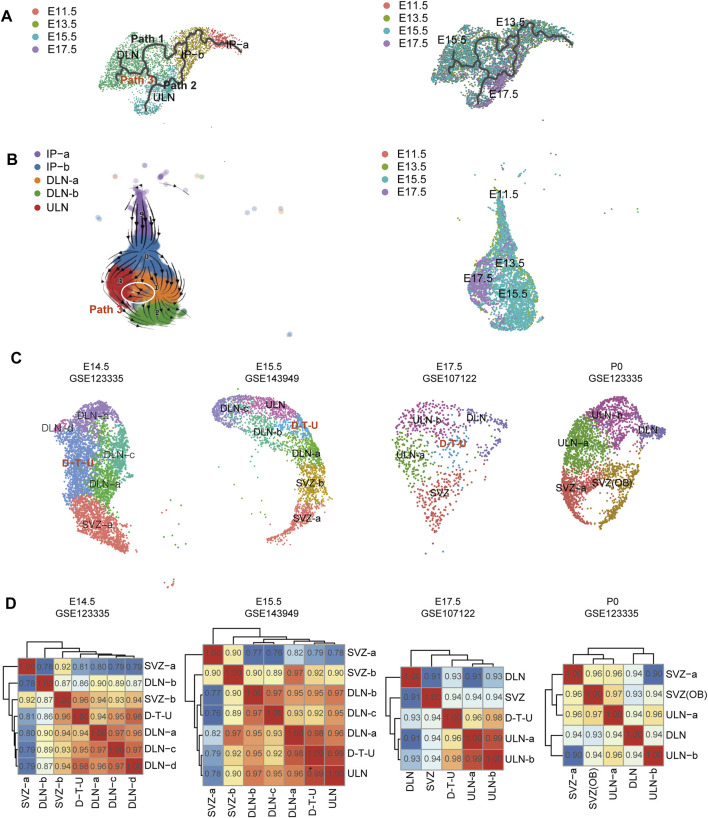
FIGURE 1.
Developmental trajectories of projection neurons in mice. Pseudotime map generated from the mouse datasets with Monocle3 (A) and scVelo (B). In left, the cells are labelled by the different cell types, while in right, cells were labelled by the sample collection timepoints. The additional path (path 3) was indicated by red fonts (A) and by a white circle (B). (C) The transcriptional profiles of D-T-U subset in mouse excitatory neurons at E14.5, E15.5, E17.5 and P0. UMAP visualization of the excitatory neurons that were identified in mouse cortex cells. Cell cluster from D-T-U is indicated in red font in each figure. (D) Similarity matrix of expression among different cell clusters. Pairwise Pearson Correlations between clusters across principal components in mouse are provided. The Pearson Correlation Coefficient between each two cluster is shown accordingly.

