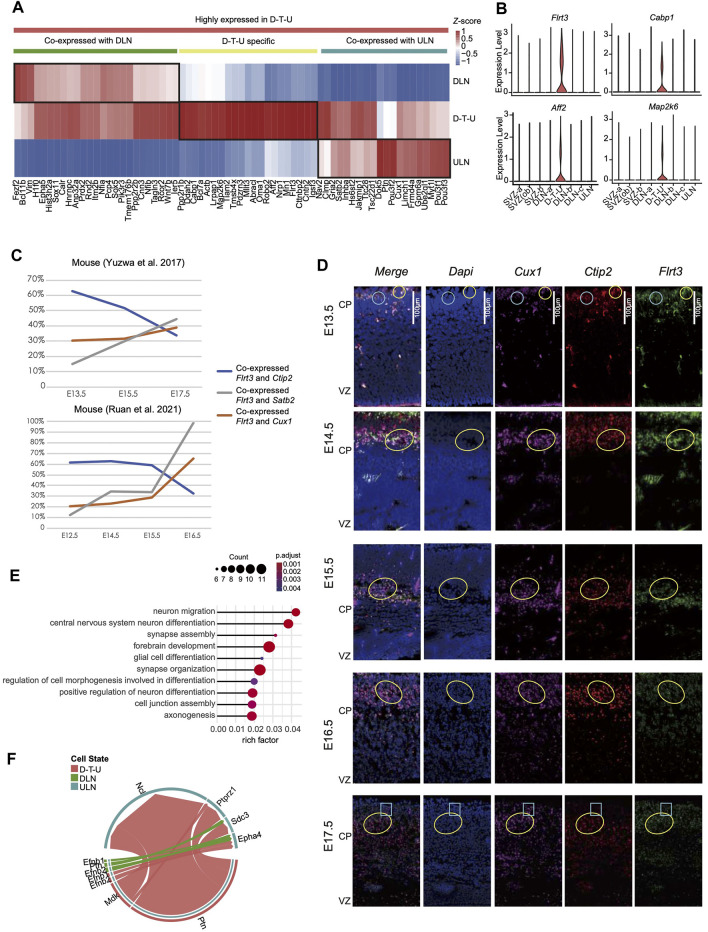
FIGURE 2.
Differentially expressed genes identified in the D-T-U cell cluster in mice. (A) The relative expression levels (Z score) of 67 genes significantly highly expressed in D-T-U cluster among D-T-U, DLNs and ULNs cells. (B) Genes uniquely expressed in the D-T-U cell cluster. (C) Percentage of cells with co-expression of Flrt3 and Ctip2 (DLN marker), Satb2 or Cux1 (ULN maker) in two studies cross different timepoints (X-axis). (D) Co-immunostaining of ULN and DLN markers in mice. The staining results of E13.5, E14.5, E15.5, E16.5 and E17.5 mice are shown, respectively. The marker used for each figure is indicated in the upper panel and the cells with co-stained signal of Cux1, Ctip2 and Flrt3 are revealed by yellow circles in each figure, while the cells with co-stained signal of Flrt3 with Cux1 or Ctip2 exclusively are indicated by blue circles/frames. (E) Enriched GO terms for upregulated genes in D-T-U compared to DLNs and ULNs in mouse. The X-axis shows rich factor, which refers to the ratio of number of genes with differentially expressed in this pathway dividing by the total number of genes in this pathway. (F) Comparison of the significantly enriched ligand-receptor pairs between D-T-U to ULNs and DLNs to ULNs. Different colors in the circle plot represent different cell groups and edge width in each circle represents the communication probability.

