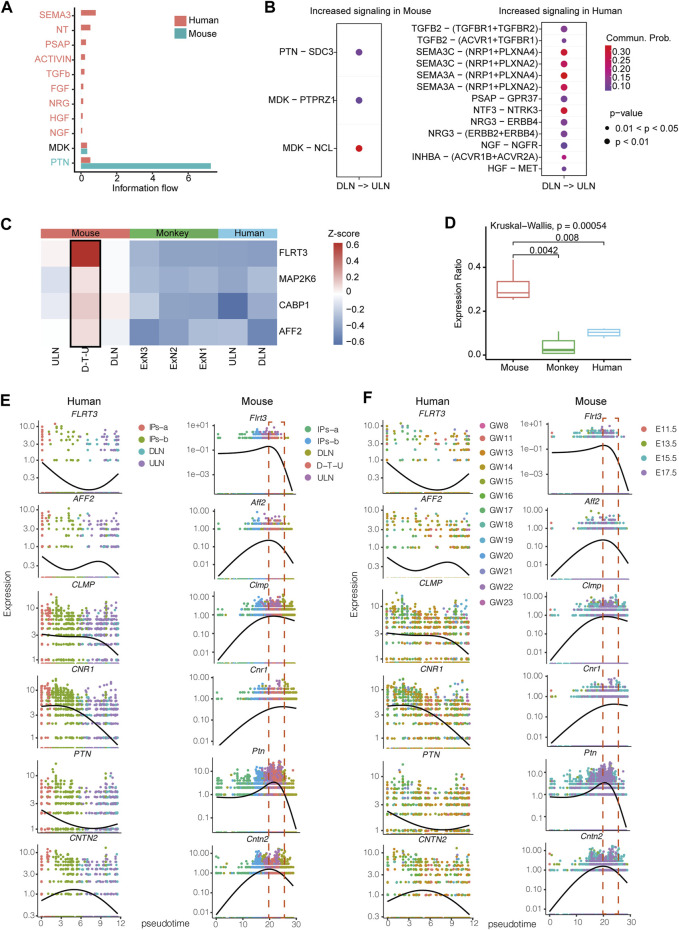
FIGURE 3.
The differences of transcriptomic profiles between human and mouse prenatal stages. (A) Significantly enriched signaling pathways in humans and mice. The order is shown based on the differences of overall information flow within the inferred networks between human and mouse. The top signaling pathways colored in red are specifically enriched in humans, the middle one colored in black is equally enriched in human and mouse, and the bottom one colored in blue are specifically enriched in mouse. (B) All significantly enriched ligand-receptor pairs that contributed to the signaling sending from DLNs to ULNs. The dot color and size represent the calculated communication probability and p-values, respectively. p-values are computed based on one-sided permutation test. (C) Comparison of Flrt3, Cabp1, Aff2 and Map2k6 expression levels among mouse, human and monkey in the neocortex projection subgroups. (D) Comparison of the factions of cells with Flrt3, Cabp1, Aff2 and Map2k6 expressions identified between mouse D-T-U, human and monkey projection neurons subtypes. Whiskers in the boxplot represent minimum and maximum; unpaired Kruskal–Wallis test. Expression heatmap of highly dynamically expressed genes ordered across pseudo-time in human and mouse labelled by different cell populations (E) or different timepoints (F).

