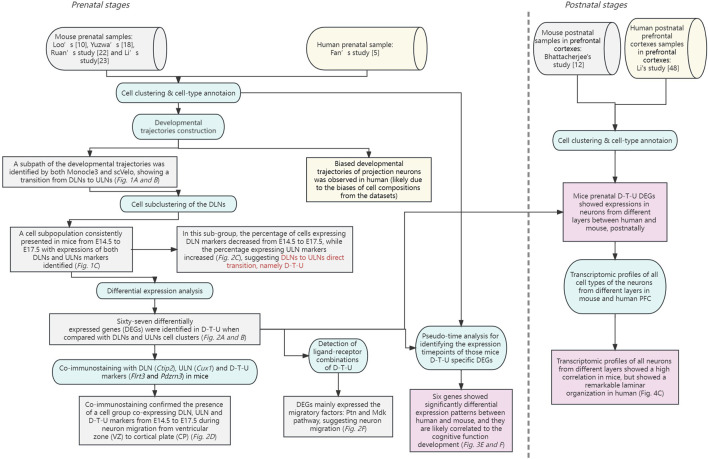
FIGURE 5.
A brief summary of the analytical and experimental workflow with key findings provided for this study. Two phases of this study are shown separately by a dotted line. The datasets used for the analyses (with references provided) are shown in cylinders. In addition, the analytical or experimental steps are shown in circular rectangles, while the key findings (with corresponding subfigures) are shown in rectangles. The datasets and findings in mouse alone are shown in grey, while the datasets and findings in human alone are shown in yellow. For the comparison results, they are shown in pink.

