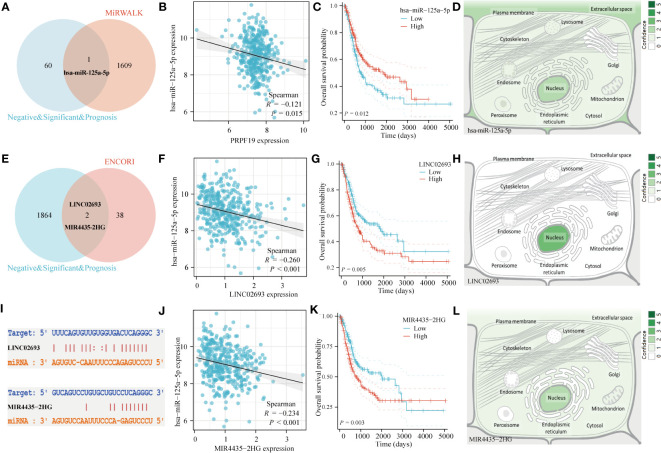
Figure 10.
Construction of ceRNA network of PRPF19 in BLCA. (A) Venn diagram of miRNA interacting with PRPF19. (B) Scatter plot of PRPF19 and hsa-miR-125a-5p correlation. (C) Overall survival curves determined using Kaplan and Meier methods for hsa-miR-125a-5p. (D) The subcellular localization of miRNAs that were screened. (E) Venn diagram of LncRNA and hsa-miR-125a-5p interactions. (F) Scatter plot of LINC02693 and hsa-miR-125a-5p correlation. (G) Kaplan-Meier overall survival curves of LINC02693. (H) The subcellular localization of screened LncRNA. (I) Targeted binding sites of hsa-miR-125a-5p to LINC02693 and MIR4435-2HG. (J) Scatter plot of MIR4435-2HG and hsa-miR-125a-5p correlation. (K) MIR4435-2HG’s Kaplan-Meier overall survival curves. (L) The subcellular localization of LncRNA that were screened.

