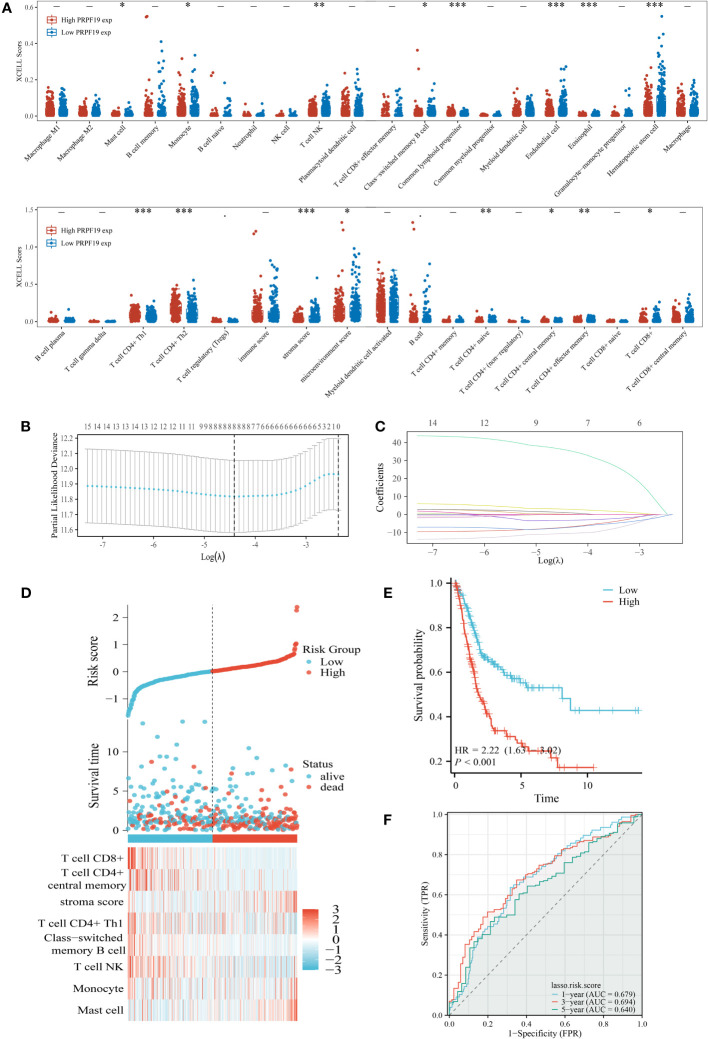
Figure 6.
Identification of the key infiltrated immune cells by LASSO. (A) Immune infiltration varies across groups with high and low PRPF19 expression. (B) Diagram depicting penalties for 38 immune cells using the LASSO model. (C) Selective feature coefficients are shown as a function of the lambda parameter. (D) Eight prognostic immune infiltration-related genes and their expression patterns in BLCA patients with varying risk scores and survival outcomes. (E, F) ROC curves and overall survival curves for high- and low-risk BLCA patients, respectively. *p < 0.05, **p < 0.01 and ***p < 0.001.

