Figure 4.

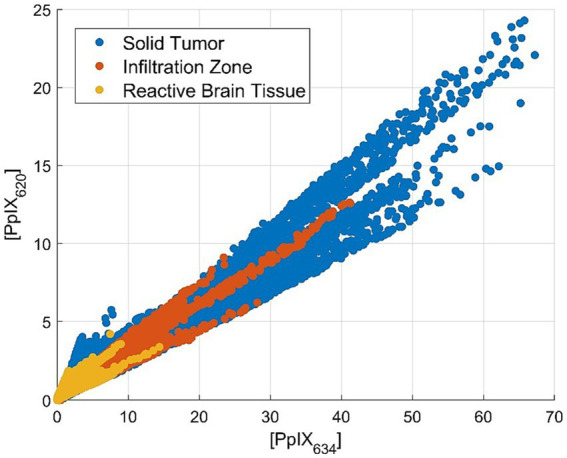
Scatterplot of the PpIX634 and PpIX620 abundance in solid tumor, infiltration zone, and reactive altered brain tissue showing approximately constant PpIX ratio.

Scatterplot of the PpIX634 and PpIX620 abundance in solid tumor, infiltration zone, and reactive altered brain tissue showing approximately constant PpIX ratio.